Health Care and Medical Properties
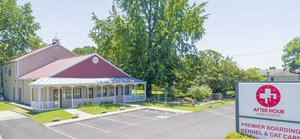
392 Kings Highway Swedesboro, NJ 08085
392 Kings Highway Swedesboro, NJ 08085

Details & Description
Property Highlights
- • Tenant Investment in Location
- • Very Passive Lease Structure
- • 247 Hybrid Emergency and Referral Hospital
- • Stable Long-Term Investment
- • 32 Year Operating History
Listing Agents

Andrew Evans
O: 949-662-2256
M: 925-360-0277
andrew.evans@matthews.com
O: 949-662-2256
M: 925-360-0277
andrew.evans@matthews.com
While we strive to provide the most accurate information, all listing information, and demographic data, is provided by third-parties. As such, MyEListing will not be responsible for the accuracy of the information. It is strongly recommended that you verify all information with the listing agent, and any relevant agencies, prior to making any decisions.