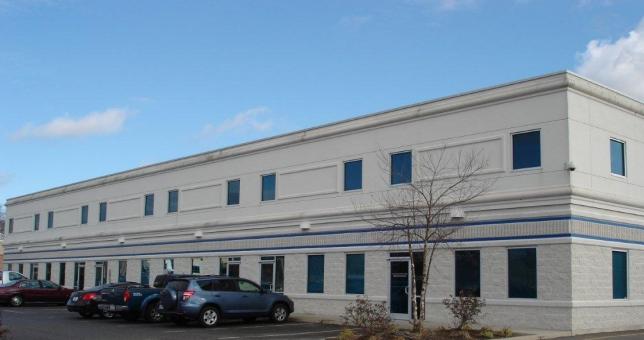
Flex-Office-Warehouse
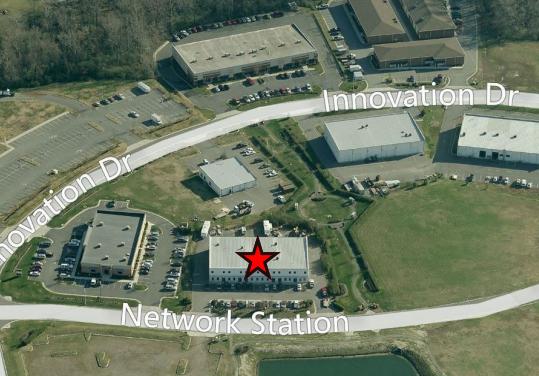
441 Network Station Chesapeake, VA 23320
441 Network Station Chesapeake, VA 23320
Details & Description
Property Highlights
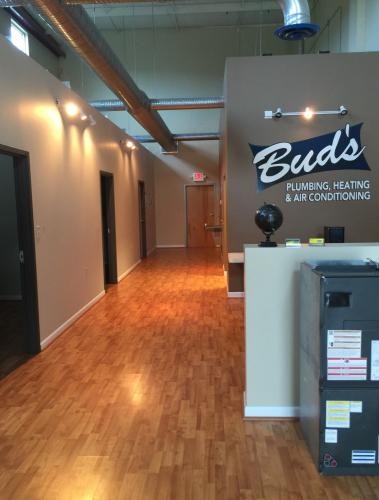
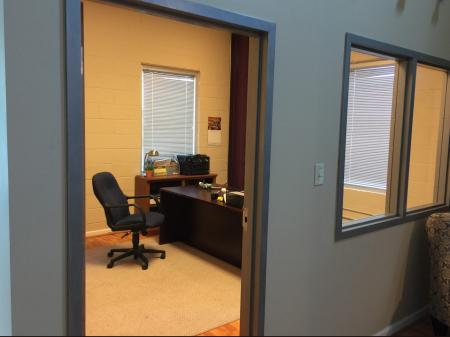
• Open Receptionist Office Area, Four Private Offices, Two bathrooms, IT Area and Break Room. Laminated Floors.
• Excellent location off Chesapeake Expressway and only 10 minutes to I-64 I-664.
Additional Photos
Listing Agents

Larry Rumsey
O: 757-523-1900
M: 757-353-2473
lrumsey@riddleassociates.com
O: 757-523-1900
M: 757-353-2473
lrumsey@riddleassociates.com
While we strive to provide the most accurate information, all listing information, and demographic data, is provided by third-parties. As such, MyEListing will not be responsible for the accuracy of the information. It is strongly recommended that you verify all information with the listing agent, and any relevant agencies, prior to making any decisions.


