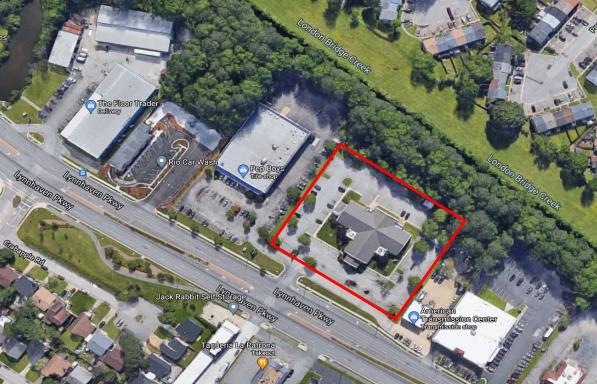
1-Mile | 3-Miles | 5-Miles | ||
---|---|---|---|---|
Total Population | 19,794 | 104,945 | 245,092 | |
Population Median Age | 34 | 36 | 37 | |
Population by Age | 0-9 Yrs | 2583 (13%) | 14248 (13%) | 31353 (12%) |
10-19 Yrs | 2342 (11%) | 12226 (11%) | 29702 (12%) | |
20-29 Yrs | 4165 (21%) | 19110 (18%) | 39520 (16%) | |
30-39 Yrs | 3352 (16%) | 16664 (15%) | 37869 (15%) | |
40-49 Yrs | 2179 (11%) | 12179 (11%) | 30936 (12%) | |
50-59 Yrs | 2581 (13%) | 13928 (13%) | 31611 (12%) | |
60-69 Yrs | 1599 (8%) | 9536 (9%) | 24982 (10%) | |
70+ Yrs | 993 (5%) | 7054 (6%) | 19120 (7%) | |
Median HH Income | $64,585 | $71,644 | $75,434 | |
Total Household Income | < 24K | 826 (11%) | 4288 (11%) | 9031 (9%) |
25-49K | 1560 (21%) | 7534 (19%) | 17994 (19%) | |
50-74K | 1911 (26%) | 8255 (21%) | 17919 (19%) | |
75-99K | 1339 (18%) | 7113 (18%) | 15412 (17%) | |
100-199K | 1444 (20%) | 9559 (25%) | 24894 (27%) | |
200K+ | 82 (1%) | 1159 (3%) | 5174 (5%) | |
Highest Education Level | No Diploma | 1184 | 5433 | 11140 |
Diploma or GED | 3523 | 17066 | 36975 | |
Some College | 4087 | 20011 | 43993 | |
Assoc. Degree | 1451 | 8483 | 18880 | |
Bachelors Degree | 2113 | 13297 | 36003 | |
Higher Degree | 819 | 5728 | 18806 | |
Total Housing Units | 7,529 | 40,288 | 95,560 | |
--Owner-Occupied | 4,165 | 24,150 | 59,302 | |
--Renter-Occupied | 2,998 | 13,758 | 31,121 | |
Owner-Occupied Values | < 100K | 232 | 994 | 2515 |
100-199K | 1833 | 7243 | 12736 | |
200-299K | 1610 | 11069 | 22591 | |
300-399K | 371 | 3453 | 13336 | |
400-499K | 36 | 884 | 4690 | |
500K+ | 83 | 506 | 3434 | |
Total Working Age Population | 15,770 | 83,178 | 195,662 | |
In Work Force | 12,207 | 61,149 | 140,687 | |
Not In Work Force | 3,562 | 22,029 | 54,975 | |
Workforce Employed | 10,611 | 52,962 | 121,837 | |
Workforce Unemployed | 603 | 2,769 | 6,333 | |
Civlian Workforce | 11,214 | 55,730 | 128,171 | |
Military Workforce | 993 | 5,418 | 12,516 | |
Total Households | 7,163 | 37,908 | 90,423 | |
Family Households | 5,121 | 26,874 | 63,521 | |
Non-Family Households | 2,042 | 11,034 | 26,902 | |
Married Couple | 3,160 | 18,326 | 46,165 | |
Other Family | 1,962 | 8,548 | 17,356 | |
Married w/Child | 1,226 | 7,739 | 19,380 | |
Single Male w/Child | 256 | 921 | 2,130 | |
Single Female w/Child | 864 | 3,296 | 6,634 |
Population Change Last Two Decades - Plus Projection
2000 | % | 2010 | % | 2020 | % | 2030 | |
---|---|---|---|---|---|---|---|
Virginia | 7,078,515 | +13 | 8,001,024 | +8 | 8,655,021 | +8 | 9,331,666 |
Chesapeake city | 199,184 | +12 | 222,209 | +12 | 249,244 | +9 | 270,506 |
Norfolk city | 234,403 | +4 | 242,803 | +2 | 246,881 | +1 | 249,889 |
Virginia Beach city | 425,257 | +3 | 437,994 | +4 | 457,699 | +2 | 467,187 |
Total Working Age Population:
Total Households:
Total Working Age Population:
Total Households:
Total Working Age Population:
Total Households: