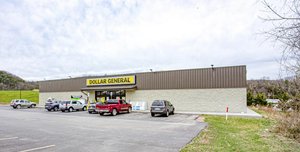
By signing in, you agree with: Terms & Conditions, Privacy Policy and Copyright
Month | Payment | Principal | Interest | Total Interest | Balance |
---|---|---|---|---|---|
$0.00 | $0.00 | $0.00 | $0.00 | $0.00 | $0.00 |
All information based on the most recently available data (updated annually) and is provided in 1-mile, 3-mile, and 5-mile radii (radiuses) of the property location.
Total Population | 10,793 | 68,234 | 243,039 | |
Population Median Age | 30 | 29 | 30 | |
Population by Age | 0-9 Yrs | 1962 (18%) | 13027 (19%) | 44442 (18%) |
10-19 Yrs | 1900 (17%) | 12213 (17%) | 44145 (18%) | |
20-29 Yrs | 1731 (16%) | 11228 (16%) | 41231 (16%) | |
30-39 Yrs | 1878 (17%) | 11534 (16%) | 37242 (15%) | |
40-49 Yrs | 1435 (13%) | 8516 (12%) | 32032 (13%) | |
50-59 Yrs | 951 (8%) | 5903 (8%) | 21913 (9%) | |
60-69 Yrs | 500 (4%) | 3805 (5%) | 13833 (5%) | |
70+ Yrs | 437 (4%) | 2008 (2%) | 8201 (3%) | |
Median HH Income | $67,489 | $60,589 | $55,425 | |
Total Household Income | < 24K | 327 (12%) | 2322 (13%) | 10410 (16%) |
25-49K | 424 (16%) | 4073 (23%) | 17308 (27%) | |
50-74K | 745 (28%) | 4169 (24%) | 14761 (23%) | |
75-99K | 543 (20%) | 2776 (16%) | 9163 (14%) | |
100-199K | 516 (19%) | 3381 (19%) | 10074 (15%) | |
200K+ | 80 (3%) | 402 (2%) | 1300 (2%) | |
Highest Education Level | No Diploma | 1493 | 9409 | 40109 |
Diploma or GED | 1990 | 12160 | 42093 | |
Some College | 1477 | 8104 | 26769 | |
Assoc. Degree | 361 | 2887 | 9610 | |
Bachelors Degree | 626 | 3628 | 10987 | |
Higher Degree | 291 | 1589 | 4797 | |
Total Housing Units | 2,711 | 18,076 | 66,604 | |
--Owner-Occupied | 1,794 | 10,790 | 34,849 | |
--Renter-Occupied | 841 | 6,334 | 28,168 | |
Owner-Occupied Values | < 100K | 89 | 860 | 3852 |
100-199K | 913 | 5097 | 17846 | |
200-299K | 712 | 4154 | 11092 | |
300-399K | 40 | 418 | 1436 | |
400-499K | 2 | 60 | 261 | |
500K+ | 37 | 201 | 362 | |
Total Working Age Population | 7,574 | 47,517 | 171,550 | |
In Work Force | 5,322 | 33,409 | 117,898 | |
Not In Work Force | 2,253 | 14,108 | 53,652 | |
Workforce Employed | 4,952 | 31,203 | 110,070 | |
Workforce Unemployed | 364 | 2,135 | 7,621 | |
Civlian Workforce | 5,316 | 33,338 | 117,691 | |
Military Workforce | 5 | 71 | 207 | |
Total Households | 2,634 | 17,124 | 63,016 | |
Family Households | 2,222 | 13,999 | 50,859 | |
Non-Family Households | 413 | 3,125 | 12,157 | |
Married Couple | 1,605 | 9,220 | 30,715 | |
Other Family | 617 | 4,779 | 20,144 | |
Married w/Child | 967 | 5,471 | 18,132 | |
Single Male w/Child | 61 | 755 | 3,654 | |
Single Female w/Child | 321 | 2,283 | 8,944 |
Population Change Last Two Decades - Plus Projection
2000 | % | 2010 | % | 2020 | % | 2030 | |
---|---|---|---|---|---|---|---|
Arizona | 5,130,632 | +25 | 6,392,017 | +14 | 7,286,100 | +14 | 8,284,900 |
Maricopa County | 3,072,149 | +24 | 3,817,117 | +16 | 4,436,900 | +15 | 5,107,700 |
Pinal County | 179,727 | +109 | 375,770 | +24 | 466,200 | +32 | 616,200 |