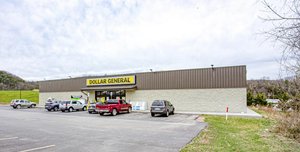
1-Mile | 3-Miles | 5-Miles | ||
---|---|---|---|---|
Total Population | 2,198 | 4,273 | 5,266 | |
Population Median Age | 33 | 33 | 33 | |
Population by Age | 0-9 Yrs | 428 (19%) | 784 (18%) | 930 (17%) |
10-19 Yrs | 379 (17%) | 719 (16%) | 884 (16%) | |
20-29 Yrs | 296 (13%) | 587 (13%) | 718 (13%) | |
30-39 Yrs | 284 (12%) | 590 (13%) | 742 (14%) | |
40-49 Yrs | 293 (13%) | 552 (12%) | 683 (12%) | |
50-59 Yrs | 181 (8%) | 401 (9%) | 477 (9%) | |
60-69 Yrs | 171 (7%) | 340 (7%) | 458 (8%) | |
70+ Yrs | 166 (7%) | 299 (6%) | 374 (7%) | |
Median HH Income | $52,184 | $58,397 | $61,241 | |
Total Household Income | < 24K | 141 (22%) | 230 (18%) | 289 (18%) |
25-49K | 167 (26%) | 317 (26%) | 381 (24%) | |
50-74K | 107 (16%) | 215 (17%) | 265 (17%) | |
75-99K | 90 (14%) | 197 (16%) | 262 (17%) | |
100-199K | 122 (19%) | 243 (19%) | 316 (20%) | |
200K+ | 7 (1%) | 14 (1%) | 25 (1%) | |
Highest Education Level | No Diploma | 503 | 974 | 1127 |
Diploma or GED | 357 | 712 | 921 | |
Some College | 183 | 376 | 487 | |
Assoc. Degree | 75 | 175 | 262 | |
Bachelors Degree | 95 | 211 | 277 | |
Higher Degree | 48 | 75 | 84 | |
Total Housing Units | 676 | 1,300 | 1,647 | |
--Owner-Occupied | 345 | 712 | 955 | |
--Renter-Occupied | 289 | 505 | 583 | |
Owner-Occupied Values | < 100K | 4 | 10 | 23 |
100-199K | 152 | 277 | 312 | |
200-299K | 117 | 249 | 351 | |
300-399K | 58 | 131 | 176 | |
400-499K | 10 | 29 | 54 | |
500K+ | 5 | 17 | 38 | |
Total Working Age Population | 1,525 | 3,028 | 3,775 | |
In Work Force | 968 | 1,992 | 2,502 | |
Not In Work Force | 558 | 1,036 | 1,273 | |
Workforce Employed | 948 | 1,945 | 2,433 | |
Workforce Unemployed | 20 | 47 | 69 | |
Civlian Workforce | 968 | 1,992 | 2,502 | |
Military Workforce | 0 | 0 | 0 | |
Total Households | 634 | 1,217 | 1,539 | |
Family Households | 484 | 944 | 1,190 | |
Non-Family Households | 151 | 273 | 349 | |
Married Couple | 323 | 654 | 846 | |
Other Family | 160 | 290 | 344 | |
Married w/Child | 201 | 410 | 523 | |
Single Male w/Child | 50 | 96 | 110 | |
Single Female w/Child | 75 | 120 | 141 |
Population Change Last Two Decades - Plus Projection
2000 | % | 2010 | % | 2020 | % | 2030 | |
---|---|---|---|---|---|---|---|
California | 33,871,648 | +10 | 37,253,956 | +9 | 40,467,295 | +8 | 43,631,295 |
Colusa County | 18,804 | +14 | 21,419 | +8 | 23,048 | +7 | 24,641 |
Total Working Age Population:
Total Households:
Total Working Age Population:
Total Households:
Total Working Age Population:
Total Households: