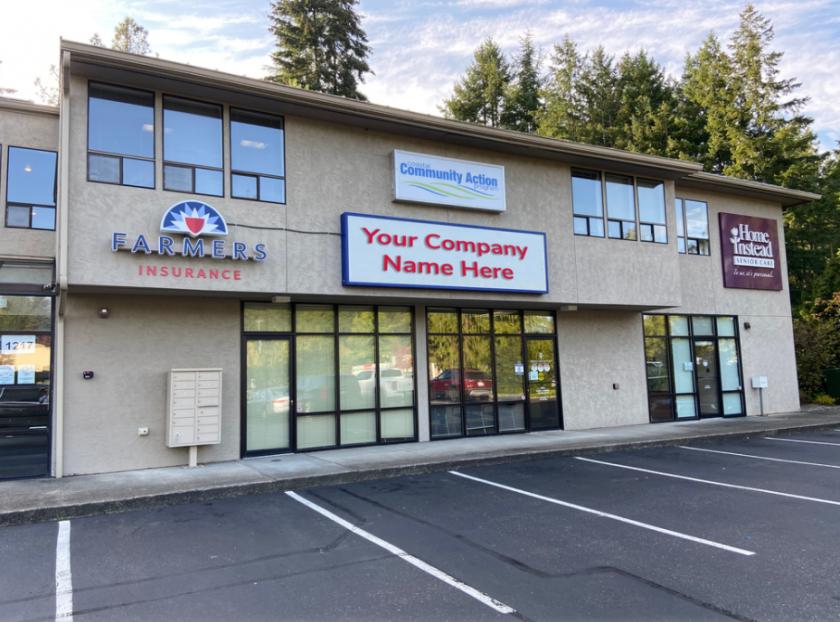
1-Mile | 3-Miles | 5-Miles | ||
---|---|---|---|---|
Total Population | 9,004 | 52,134 | 99,969 | |
Population Median Age | 37 | 40 | 40 | |
Population by Age | 0-9 Yrs | 1028 (11%) | 4806 (9%) | 10273 (10%) |
10-19 Yrs | 1058 (11%) | 4815 (9%) | 10637 (10%) | |
20-29 Yrs | 2015 (22%) | 9627 (18%) | 15401 (15%) | |
30-39 Yrs | 1385 (15%) | 8735 (16%) | 14571 (14%) | |
40-49 Yrs | 879 (9%) | 6175 (11%) | 12408 (12%) | |
50-59 Yrs | 719 (7%) | 5806 (11%) | 12503 (12%) | |
60-69 Yrs | 903 (10%) | 6212 (11%) | 12786 (12%) | |
70+ Yrs | 1016 (11%) | 5958 (11%) | 11391 (11%) | |
Median HH Income | $43,622 | $58,757 | $66,900 | |
Total Household Income | < 24K | 1132 (28%) | 4900 (20%) | 7868 (18%) |
25-49K | 1141 (28%) | 5148 (22%) | 8580 (20%) | |
50-74K | 721 (18%) | 4122 (17%) | 7158 (16%) | |
75-99K | 412 (10%) | 3010 (12%) | 6163 (14%) | |
100-199K | 494 (12%) | 4914 (21%) | 10252 (23%) | |
200K+ | 88 (2%) | 1243 (5%) | 2805 (6%) | |
Highest Education Level | No Diploma | 552 | 2222 | 4189 |
Diploma or GED | 1151 | 5888 | 11825 | |
Some College | 1374 | 9074 | 17006 | |
Assoc. Degree | 724 | 3545 | 7108 | |
Bachelors Degree | 1142 | 9974 | 18427 | |
Higher Degree | 895 | 7280 | 13766 | |
Total Housing Units | 4,314 | 24,721 | 45,285 | |
--Owner-Occupied | 926 | 10,704 | 23,021 | |
--Renter-Occupied | 3,061 | 12,634 | 19,807 | |
Owner-Occupied Values | < 100K | 169 | 584 | 1245 |
100-199K | 117 | 1234 | 2402 | |
200-299K | 306 | 3349 | 6717 | |
300-399K | 203 | 3268 | 6830 | |
400-499K | 84 | 1153 | 2730 | |
500K+ | 47 | 1116 | 3096 | |
Total Working Age Population | 7,564 | 44,691 | 83,718 | |
In Work Force | 4,509 | 28,563 | 53,178 | |
Not In Work Force | 3,056 | 16,127 | 30,541 | |
Workforce Employed | 4,213 | 26,288 | 49,231 | |
Workforce Unemployed | 253 | 1,889 | 3,269 | |
Civlian Workforce | 4,467 | 28,177 | 52,500 | |
Military Workforce | 42 | 387 | 678 | |
Total Households | 3,987 | 23,338 | 42,828 | |
Family Households | 2,037 | 11,900 | 24,414 | |
Non-Family Households | 1,950 | 11,438 | 18,414 | |
Married Couple | 1,160 | 8,511 | 18,368 | |
Other Family | 877 | 3,390 | 6,046 | |
Married w/Child | 523 | 3,119 | 6,860 | |
Single Male w/Child | 69 | 429 | 934 | |
Single Female w/Child | 500 | 1,480 | 2,655 |
Population Change Last Two Decades - Plus Projection
2000 | % | 2010 | % | 2020 | % | 2030 | |
---|---|---|---|---|---|---|---|
Washington | 5,894,121 | +14 | 6,724,540 | +14 | 7,638,415 | +11 | 8,503,178 |
Mason County | 49,405 | +23 | 60,699 | +11 | 67,621 | +13 | 76,530 |
Pierce County | 700,820 | +13 | 795,225 | +13 | 901,251 | +11 | 1,002,412 |
Thurston County | 207,355 | +22 | 252,264 | +17 | 294,333 | +14 | 335,965 |
Total Working Age Population:
Total Households:
Total Working Age Population:
Total Households:
Total Working Age Population:
Total Households: