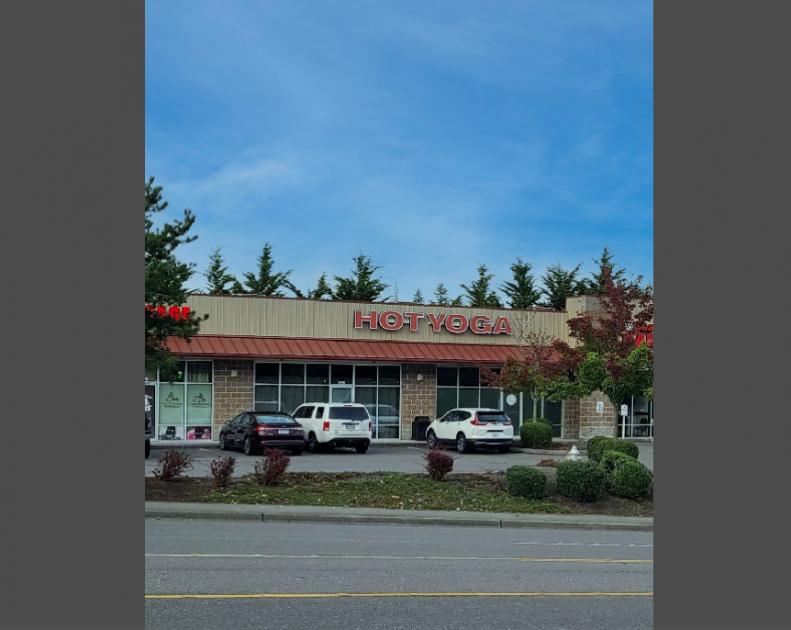
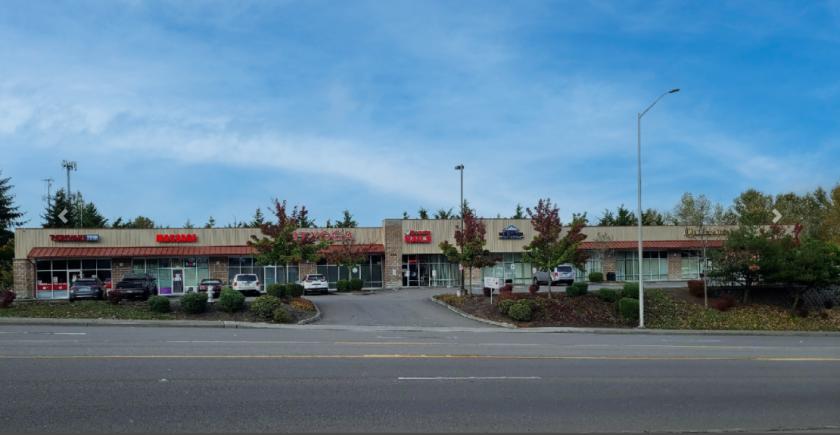
1-Mile | 3-Miles | 5-Miles | ||
---|---|---|---|---|
Total Population | 6,652 | 55,252 | 219,286 | |
Population Median Age | 36 | 38 | 37 | |
Population by Age | 0-9 Yrs | 728 (10%) | 6850 (12%) | 28792 (13%) |
10-19 Yrs | 965 (14%) | 7192 (13%) | 30098 (13%) | |
20-29 Yrs | 1007 (15%) | 7753 (14%) | 31495 (14%) | |
30-39 Yrs | 1238 (18%) | 7814 (14%) | 31613 (14%) | |
40-49 Yrs | 903 (13%) | 6549 (11%) | 27900 (12%) | |
50-59 Yrs | 735 (11%) | 7654 (13%) | 28264 (12%) | |
60-69 Yrs | 514 (7%) | 6205 (11%) | 22133 (10%) | |
70+ Yrs | 562 (8%) | 5235 (9%) | 18992 (8%) | |
Median HH Income | $67,879 | $78,180 | $69,489 | |
Total Household Income | < 24K | 340 (13%) | 2364 (11%) | 11405 (14%) |
25-49K | 490 (19%) | 3277 (16%) | 15350 (19%) | |
50-74K | 581 (23%) | 3843 (19%) | 15879 (20%) | |
75-99K | 418 (16%) | 3079 (15%) | 12165 (15%) | |
100-199K | 582 (23%) | 6015 (30%) | 19974 (25%) | |
200K+ | 55 (2%) | 1173 (5%) | 3484 (4%) | |
Highest Education Level | No Diploma | 311 | 3246 | 15996 |
Diploma or GED | 1587 | 12317 | 44830 | |
Some College | 1125 | 9641 | 37785 | |
Assoc. Degree | 658 | 4237 | 16676 | |
Bachelors Degree | 584 | 5884 | 22213 | |
Higher Degree | 196 | 2786 | 9028 | |
Total Housing Units | 2,673 | 20,944 | 82,900 | |
--Owner-Occupied | 1,185 | 13,497 | 48,710 | |
--Renter-Occupied | 1,281 | 6,254 | 29,547 | |
Owner-Occupied Values | < 100K | 29 | 842 | 3791 |
100-199K | 200 | 1575 | 8504 | |
200-299K | 382 | 4524 | 17626 | |
300-399K | 271 | 3850 | 11921 | |
400-499K | 201 | 1552 | 4182 | |
500K+ | 102 | 1154 | 2685 | |
Total Working Age Population | 5,417 | 44,147 | 172,608 | |
In Work Force | 3,724 | 28,649 | 111,364 | |
Not In Work Force | 1,692 | 15,498 | 61,245 | |
Workforce Employed | 3,262 | 26,848 | 103,390 | |
Workforce Unemployed | 398 | 1,489 | 6,539 | |
Civlian Workforce | 3,660 | 28,337 | 109,929 | |
Military Workforce | 65 | 313 | 1,435 | |
Total Households | 2,466 | 19,751 | 78,257 | |
Family Households | 1,665 | 13,872 | 53,718 | |
Non-Family Households | 801 | 5,879 | 24,539 | |
Married Couple | 1,017 | 10,313 | 38,130 | |
Other Family | 648 | 3,559 | 15,588 | |
Married w/Child | 476 | 3,893 | 16,100 | |
Single Male w/Child | 44 | 576 | 2,540 | |
Single Female w/Child | 308 | 1,300 | 5,968 |
Population Change Last Two Decades - Plus Projection
2000 | % | 2010 | % | 2020 | % | 2030 | |
---|---|---|---|---|---|---|---|
Washington | 5,894,121 | +14 | 6,724,540 | +14 | 7,638,415 | +11 | 8,503,178 |
King County | 1,737,034 | +11 | 1,931,249 | +16 | 2,231,408 | +11 | 2,474,625 |
Pierce County | 700,820 | +13 | 795,225 | +13 | 901,251 | +11 | 1,002,412 |
Thurston County | 207,355 | +22 | 252,264 | +17 | 294,333 | +14 | 335,965 |
Total Working Age Population:
Total Households:
Total Working Age Population:
Total Households:
Total Working Age Population:
Total Households: