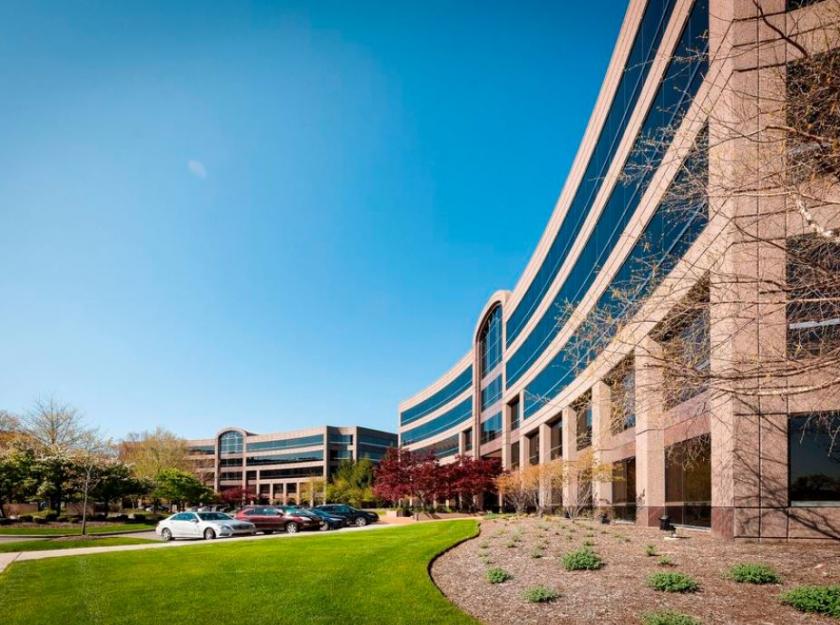
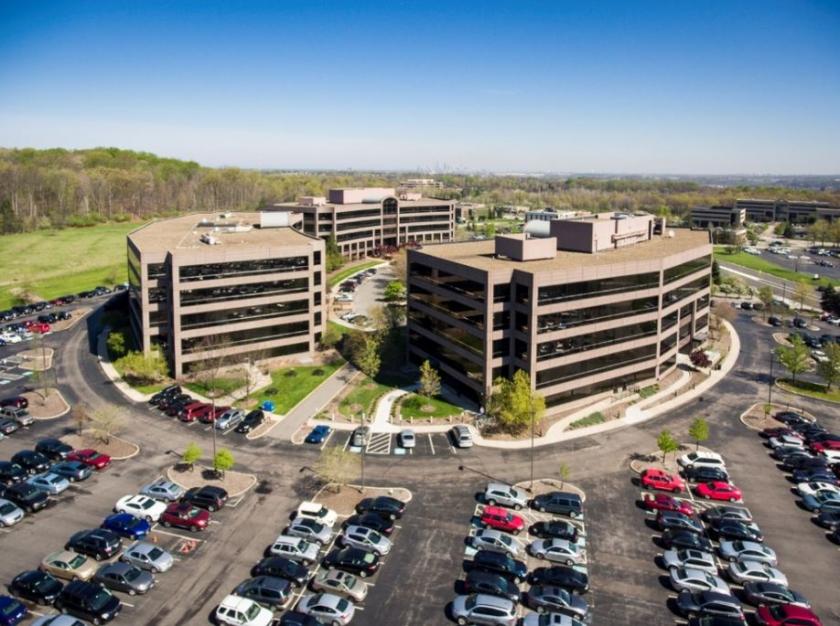
1-Mile | 3-Miles | 5-Miles | ||
---|---|---|---|---|
Total Population | 4,446 | 57,784 | 224,083 | |
Population Median Age | 46 | 43 | 41 | |
Population by Age | 0-9 Yrs | 395 (8%) | 5635 (9%) | 24381 (10%) |
10-19 Yrs | 380 (8%) | 6233 (10%) | 27397 (12%) | |
20-29 Yrs | 451 (10%) | 6420 (11%) | 28570 (12%) | |
30-39 Yrs | 579 (13%) | 7315 (12%) | 28519 (12%) | |
40-49 Yrs | 456 (10%) | 7179 (12%) | 27065 (12%) | |
50-59 Yrs | 668 (15%) | 8715 (15%) | 33752 (15%) | |
60-69 Yrs | 718 (16%) | 8406 (14%) | 28368 (12%) | |
70+ Yrs | 798 (17%) | 7881 (13%) | 26031 (11%) | |
Median HH Income | $84,298 | $59,091 | $50,134 | |
Total Household Income | < 24K | 223 (11%) | 4198 (16%) | 22988 (24%) |
25-49K | 317 (16%) | 6177 (24%) | 24452 (25%) | |
50-74K | 265 (13%) | 4787 (19%) | 18223 (19%) | |
75-99K | 392 (20%) | 3478 (14%) | 11882 (12%) | |
100-199K | 606 (31%) | 5357 (21%) | 15004 (15%) | |
200K+ | 98 (5%) | 810 (3%) | 2560 (2%) | |
Highest Education Level | No Diploma | 154 | 3541 | 18110 |
Diploma or GED | 994 | 14386 | 56354 | |
Some College | 756 | 9932 | 36049 | |
Assoc. Degree | 309 | 3733 | 13320 | |
Bachelors Degree | 856 | 7651 | 23884 | |
Higher Degree | 417 | 3657 | 11083 | |
Total Housing Units | 1,977 | 26,587 | 106,487 | |
--Owner-Occupied | 1,738 | 18,840 | 62,491 | |
--Renter-Occupied | 163 | 5,966 | 32,618 | |
Owner-Occupied Values | < 100K | 51 | 5984 | 29138 |
100-199K | 1200 | 9512 | 24665 | |
200-299K | 338 | 2301 | 5535 | |
300-399K | 94 | 539 | 1727 | |
400-499K | 47 | 309 | 784 | |
500K+ | 8 | 196 | 642 | |
Total Working Age Population | 3,824 | 48,450 | 183,919 | |
In Work Force | 2,414 | 31,556 | 118,347 | |
Not In Work Force | 1,409 | 16,894 | 65,572 | |
Workforce Employed | 2,315 | 29,939 | 109,425 | |
Workforce Unemployed | 100 | 1,606 | 8,854 | |
Civlian Workforce | 2,414 | 31,545 | 118,278 | |
Military Workforce | 0 | 11 | 68 | |
Total Households | 1,902 | 24,806 | 95,108 | |
Family Households | 1,266 | 15,146 | 55,818 | |
Non-Family Households | 636 | 9,660 | 39,291 | |
Married Couple | 1,043 | 11,015 | 35,470 | |
Other Family | 223 | 4,131 | 20,348 | |
Married w/Child | 269 | 3,472 | 11,538 | |
Single Male w/Child | 31 | 565 | 2,168 | |
Single Female w/Child | 37 | 1,368 | 8,219 |
Population Change Last Two Decades - Plus Projection
2000 | % | 2010 | % | 2020 | % | 2030 | |
---|---|---|---|---|---|---|---|
Ohio | 11,353,140 | +2 | 11,536,504 | 0 | 11,574,870 | 0 | 11,615,100 |
Cuyahoga County | 1,393,978 | -8 | 1,280,122 | -6 | 1,209,550 | -5 | 1,154,210 |
Summit County | 542,899 | 0 | 541,781 | -1 | 534,150 | -1 | 528,990 |
Total Working Age Population:
Total Households:
Total Working Age Population:
Total Households:
Total Working Age Population:
Total Households: