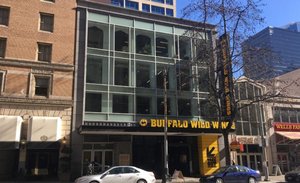
1-Mile | 3-Miles | 5-Miles | ||
---|---|---|---|---|
Total Population | 18,007 | 100,627 | 264,249 | |
Population Median Age | 34 | 36 | 38 | |
Population by Age | 0-9 Yrs | 2142 (11%) | 13780 (13%) | 33719 (12%) |
10-19 Yrs | 1320 (7%) | 9394 (9%) | 27826 (10%) | |
20-29 Yrs | 4164 (23%) | 14933 (14%) | 35012 (13%) | |
30-39 Yrs | 4866 (27%) | 22556 (22%) | 48643 (18%) | |
40-49 Yrs | 2094 (11%) | 14229 (14%) | 39001 (14%) | |
50-59 Yrs | 1242 (6%) | 10119 (10%) | 31809 (12%) | |
60-69 Yrs | 1245 (6%) | 8556 (8%) | 24890 (9%) | |
70+ Yrs | 935 (5%) | 7059 (7%) | 23349 (8%) | |
Median HH Income | $121,934 | $127,665 | $126,572 | |
Total Household Income | < 24K | 895 (10%) | 3056 (7%) | 8930 (8%) |
25-49K | 820 (10%) | 3917 (9%) | 9970 (9%) | |
50-74K | 625 (7%) | 4024 (9%) | 10731 (10%) | |
75-99K | 962 (11%) | 4304 (10%) | 11301 (10%) | |
100-199K | 3238 (39%) | 15111 (37%) | 36351 (34%) | |
200K+ | 1620 (19%) | 10012 (24%) | 28696 (27%) | |
Highest Education Level | No Diploma | 337 | 2463 | 6627 |
Diploma or GED | 1018 | 6343 | 17084 | |
Some College | 1435 | 8986 | 24603 | |
Assoc. Degree | 786 | 4377 | 11962 | |
Bachelors Degree | 5288 | 27608 | 73792 | |
Higher Degree | 4540 | 23452 | 57117 | |
Total Housing Units | 8,709 | 42,583 | 112,578 | |
--Owner-Occupied | 2,692 | 21,114 | 61,181 | |
--Renter-Occupied | 5,468 | 19,310 | 44,798 | |
Owner-Occupied Values | < 100K | 62 | 463 | 895 |
100-199K | 78 | 625 | 1300 | |
200-299K | 170 | 1019 | 2770 | |
300-399K | 200 | 1313 | 3982 | |
400-499K | 321 | 1865 | 4852 | |
500K+ | 1862 | 15830 | 47382 | |
Total Working Age Population | 15,130 | 80,904 | 212,706 | |
In Work Force | 11,309 | 57,886 | 146,255 | |
Not In Work Force | 3,821 | 23,018 | 66,452 | |
Workforce Employed | 10,953 | 55,956 | 141,275 | |
Workforce Unemployed | 352 | 1,917 | 4,943 | |
Civlian Workforce | 11,305 | 57,873 | 146,218 | |
Military Workforce | 4 | 13 | 36 | |
Total Households | 8,161 | 40,425 | 105,979 | |
Family Households | 4,321 | 26,606 | 69,896 | |
Non-Family Households | 3,840 | 13,818 | 36,083 | |
Married Couple | 3,811 | 23,110 | 61,059 | |
Other Family | 510 | 3,496 | 8,837 | |
Married w/Child | 1,838 | 11,668 | 29,598 | |
Single Male w/Child | 92 | 460 | 1,403 | |
Single Female w/Child | 181 | 1,234 | 3,070 |
Population Change Last Two Decades - Plus Projection
2000 | % | 2010 | % | 2020 | % | 2030 | |
---|---|---|---|---|---|---|---|
Washington | 5,894,121 | +14 | 6,724,540 | +14 | 7,638,415 | +11 | 8,503,178 |
King County | 1,737,034 | +11 | 1,931,249 | +16 | 2,231,408 | +11 | 2,474,625 |
Total Working Age Population:
Total Households:
Total Working Age Population:
Total Households:
Total Working Age Population:
Total Households: