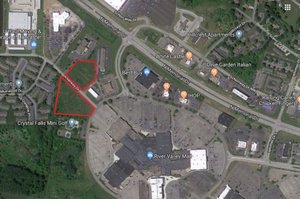
1-Mile | 3-Miles | 5-Miles | ||
---|---|---|---|---|
Total Population | 15,033 | 69,808 | 165,873 | |
Population Median Age | 36 | 35 | 37 | |
Population by Age | 0-9 Yrs | 1945 (12%) | 9854 (14%) | 22418 (13%) |
10-19 Yrs | 2530 (16%) | 10242 (14%) | 21647 (13%) | |
20-29 Yrs | 1628 (10%) | 8939 (12%) | 22114 (13%) | |
30-39 Yrs | 2267 (15%) | 11260 (16%) | 27210 (16%) | |
40-49 Yrs | 2280 (15%) | 9659 (13%) | 22498 (13%) | |
50-59 Yrs | 2278 (15%) | 9420 (13%) | 21231 (12%) | |
60-69 Yrs | 1355 (9%) | 6405 (9%) | 16791 (10%) | |
70+ Yrs | 750 (4%) | 4028 (5%) | 11963 (7%) | |
Median HH Income | $93,260 | $84,479 | $81,141 | |
Total Household Income | < 24K | 574 (10%) | 3242 (11%) | 7379 (11%) |
25-49K | 761 (13%) | 4449 (16%) | 11654 (17%) | |
50-74K | 772 (13%) | 4290 (15%) | 12074 (18%) | |
75-99K | 915 (16%) | 4244 (15%) | 9862 (14%) | |
100-199K | 2176 (39%) | 9043 (33%) | 19560 (29%) | |
200K+ | 352 (6%) | 1913 (7%) | 6531 (9%) | |
Highest Education Level | No Diploma | 417 | 1984 | 6157 |
Diploma or GED | 1937 | 8350 | 20519 | |
Some College | 1859 | 8683 | 19246 | |
Assoc. Degree | 773 | 3544 | 7595 | |
Bachelors Degree | 3046 | 14668 | 37149 | |
Higher Degree | 1731 | 8771 | 23127 | |
Total Housing Units | 5,631 | 28,162 | 70,422 | |
--Owner-Occupied | 4,339 | 18,218 | 42,150 | |
--Renter-Occupied | 1,210 | 8,963 | 24,910 | |
Owner-Occupied Values | < 100K | 369 | 1254 | 3368 |
100-199K | 1965 | 7381 | 14219 | |
200-299K | 1730 | 6539 | 12975 | |
300-399K | 220 | 2152 | 5669 | |
400-499K | 33 | 550 | 2392 | |
500K+ | 23 | 343 | 3527 | |
Total Working Age Population | 11,557 | 53,460 | 129,365 | |
In Work Force | 8,750 | 40,512 | 94,555 | |
Not In Work Force | 2,806 | 12,947 | 34,810 | |
Workforce Employed | 8,522 | 39,488 | 92,049 | |
Workforce Unemployed | 227 | 961 | 2,368 | |
Civlian Workforce | 8,750 | 40,449 | 94,417 | |
Military Workforce | 1 | 63 | 139 | |
Total Households | 5,549 | 27,181 | 67,060 | |
Family Households | 3,994 | 18,472 | 43,255 | |
Non-Family Households | 1,555 | 8,709 | 23,805 | |
Married Couple | 3,217 | 14,118 | 33,593 | |
Other Family | 777 | 4,354 | 9,662 | |
Married w/Child | 1,763 | 6,845 | 15,349 | |
Single Male w/Child | 129 | 606 | 1,348 | |
Single Female w/Child | 366 | 2,102 | 4,166 |
Population Change Last Two Decades - Plus Projection
2000 | % | 2010 | % | 2020 | % | 2030 | |
---|---|---|---|---|---|---|---|
Ohio | 11,353,140 | +2 | 11,536,504 | 0 | 11,574,870 | 0 | 11,615,100 |
Franklin County | 1,068,978 | +9 | 1,163,414 | +11 | 1,291,320 | +8 | 1,394,980 |
Madison County | 40,213 | +8 | 43,435 | +5 | 45,670 | +4 | 47,420 |
Total Working Age Population:
Total Households:
Total Working Age Population:
Total Households:
Total Working Age Population:
Total Households: