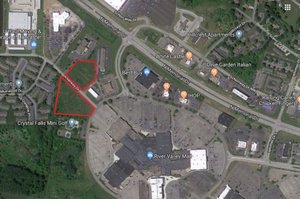
1-Mile | 3-Miles | 5-Miles | ||
---|---|---|---|---|
Total Population | 1,531 | 9,950 | 21,018 | |
Population Median Age | 40 | 40 | 40 | |
Population by Age | 0-9 Yrs | 234 (15%) | 1429 (14%) | 2820 (13%) |
10-19 Yrs | 176 (11%) | 1161 (11%) | 2734 (13%) | |
20-29 Yrs | 121 (7%) | 909 (9%) | 1980 (9%) | |
30-39 Yrs | 194 (12%) | 1208 (12%) | 2544 (12%) | |
40-49 Yrs | 169 (11%) | 1228 (12%) | 2736 (13%) | |
50-59 Yrs | 245 (16%) | 1538 (15%) | 3170 (15%) | |
60-69 Yrs | 216 (14%) | 1326 (13%) | 2782 (13%) | |
70+ Yrs | 177 (11%) | 1150 (11%) | 2251 (10%) | |
Median HH Income | $98,343 | $92,903 | $86,370 | |
Total Household Income | < 24K | 22 (4%) | 227 (6%) | 717 (9%) |
25-49K | 59 (11%) | 436 (12%) | 1077 (14%) | |
50-74K | 64 (12%) | 483 (13%) | 1223 (16%) | |
75-99K | 125 (23%) | 822 (23%) | 1599 (21%) | |
100-199K | 216 (41%) | 1268 (36%) | 2310 (30%) | |
200K+ | 36 (6%) | 233 (6%) | 563 (7%) | |
Highest Education Level | No Diploma | 67 | 456 | 961 |
Diploma or GED | 310 | 2040 | 4247 | |
Some College | 226 | 1564 | 3265 | |
Assoc. Degree | 103 | 662 | 1378 | |
Bachelors Degree | 265 | 1672 | 3302 | |
Higher Degree | 90 | 550 | 1404 | |
Total Housing Units | 527 | 3,559 | 7,839 | |
--Owner-Occupied | 504 | 3,090 | 6,203 | |
--Renter-Occupied | 17 | 379 | 1,287 | |
Owner-Occupied Values | < 100K | 10 | 108 | 448 |
100-199K | 192 | 1174 | 2311 | |
200-299K | 216 | 1248 | 2138 | |
300-399K | 66 | 400 | 741 | |
400-499K | 11 | 79 | 231 | |
500K+ | 9 | 82 | 334 | |
Total Working Age Population | 1,177 | 7,746 | 16,362 | |
In Work Force | 802 | 5,205 | 10,813 | |
Not In Work Force | 375 | 2,541 | 5,549 | |
Workforce Employed | 754 | 4,941 | 10,355 | |
Workforce Unemployed | 44 | 246 | 424 | |
Civlian Workforce | 798 | 5,187 | 10,779 | |
Military Workforce | 4 | 18 | 34 | |
Total Households | 521 | 3,469 | 7,490 | |
Family Households | 448 | 2,903 | 5,892 | |
Non-Family Households | 73 | 566 | 1,599 | |
Married Couple | 389 | 2,433 | 4,866 | |
Other Family | 59 | 469 | 1,026 | |
Married w/Child | 132 | 816 | 1,755 | |
Single Male w/Child | 8 | 65 | 140 | |
Single Female w/Child | 7 | 122 | 354 |
Population Change Last Two Decades - Plus Projection
2000 | % | 2010 | % | 2020 | % | 2030 | |
---|---|---|---|---|---|---|---|
Ohio | 11,353,140 | +2 | 11,536,504 | 0 | 11,574,870 | 0 | 11,615,100 |
Licking County | 145,491 | +14 | 166,492 | +9 | 180,860 | +9 | 196,570 |
Total Working Age Population:
Total Households:
Total Working Age Population:
Total Households:
Total Working Age Population:
Total Households: