Office Space
140 Lakeside Avenue Seattle, WA 98122
140 Lakeside Avenue Seattle, WA 98122

Details & Description
Property Highlights
• Numerous restaurants and cafes within walking distance - some with waterfront dining
• Prominent Leschi location some officessuites have water views
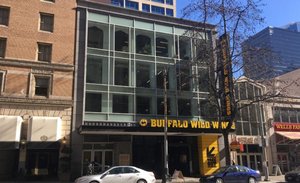
Additional Photos


Listing Agents

Aaron Mathieu
O: 206-210-5207
M: 206-948-4670
amathieu@lee-associates.com
O: 206-210-5207
M: 206-948-4670
amathieu@lee-associates.com

Jim Reed
O: 206-210-5202
M: 425-679-1681
jreed@lee-associates.com
O: 206-210-5202
M: 425-679-1681
jreed@lee-associates.com
While we strive to provide the most accurate information, all listing information, and demographic data, is provided by third-parties. As such, MyEListing will not be responsible for the accuracy of the information. It is strongly recommended that you verify all information with the listing agent, and any relevant agencies, prior to making any decisions.