Office Space
672 South Van Ness Avenue San Francisco, CA 94110
672 South Van Ness Avenue San Francisco, CA 94110

Details & Description
Property Highlights
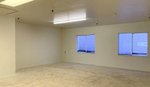
- • 2nd Floor Space
- • Open Plan
- • Great Natural Light
- • Two 2 Blocks from Bart
- • Close to Neighborhood amenities
Listing Agents

Thomas Mensendiek
M: 925-300-6348
T.Mensendiek@jll.com
M: 925-300-6348
T.Mensendiek@jll.com
While we strive to provide the most accurate information, all listing information, and demographic data, is provided by third-parties. As such, MyEListing will not be responsible for the accuracy of the information. It is strongly recommended that you verify all information with the listing agent, and any relevant agencies, prior to making any decisions.