Flex-Office-Warehouse
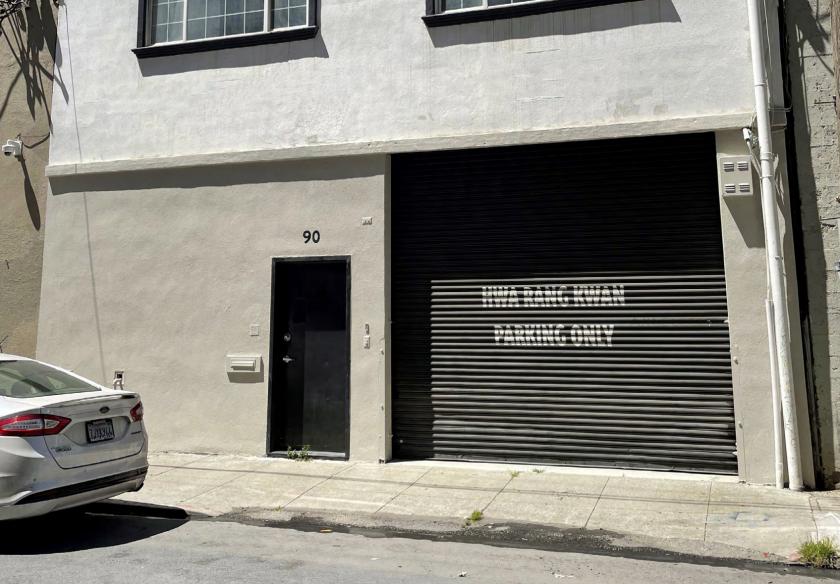
90 Welsh Street San Francisco, CA 94107
90 Welsh Street San Francisco, CA 94107
Details & Description
Property Highlights
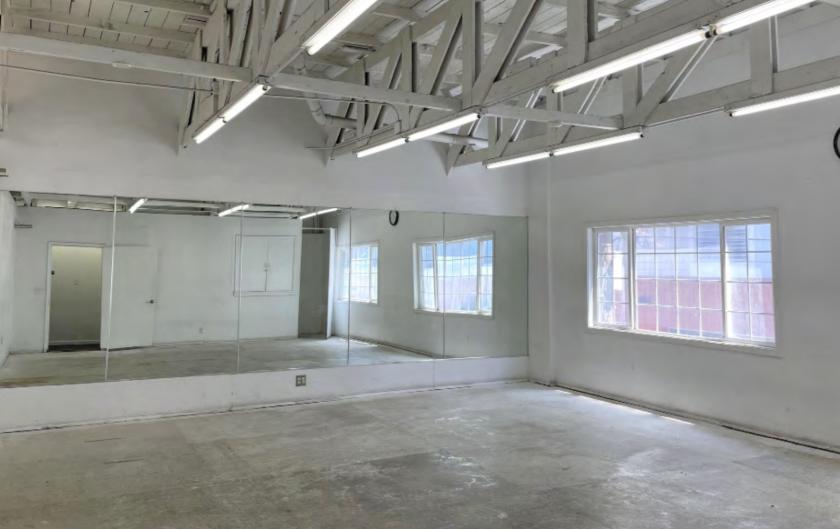
- • Open Plan
- • Two Full Floors
- • Great Natural Light
- • High Ceilings
- • Three 3 Private Bathrooms
- • Two 2 Showers
Listing Agents

Thomas Mensendiek
M: 925-300-6348
T.Mensendiek@jll.com
M: 925-300-6348
T.Mensendiek@jll.com
While we strive to provide the most accurate information, all listing information, and demographic data, is provided by third-parties. As such, MyEListing will not be responsible for the accuracy of the information. It is strongly recommended that you verify all information with the listing agent, and any relevant agencies, prior to making any decisions.