Flex-Office-Warehouse
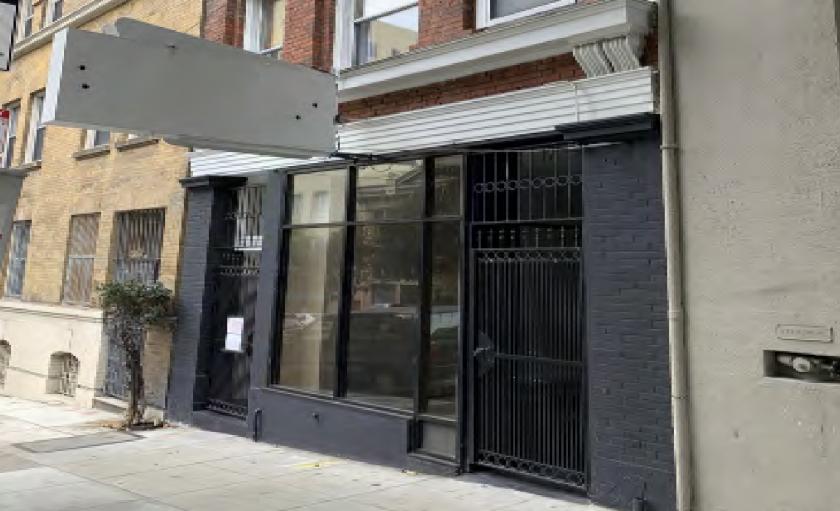
1006 Sutter Street San Francisco, CA 94109
1006 Sutter Street San Francisco, CA 94109
Details & Description
Property Highlights
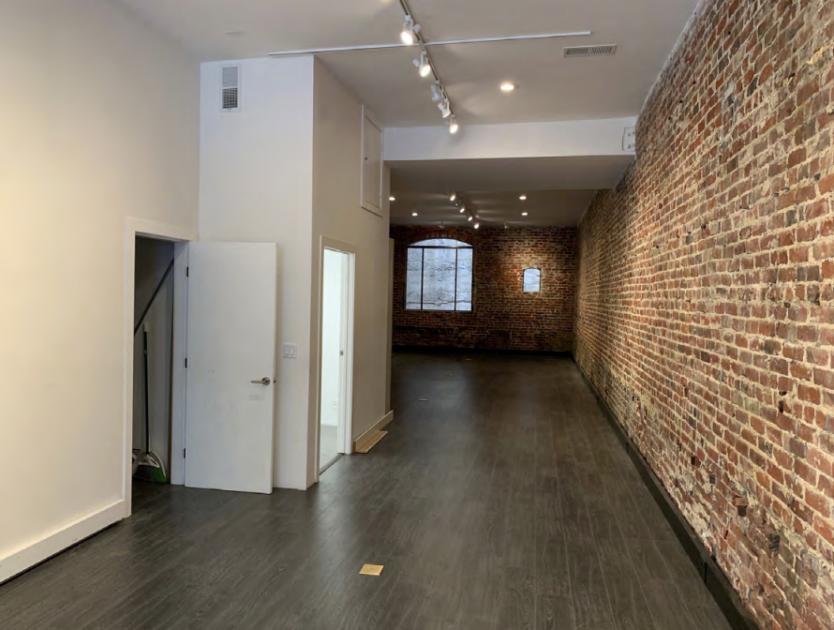
- • Ground Floor
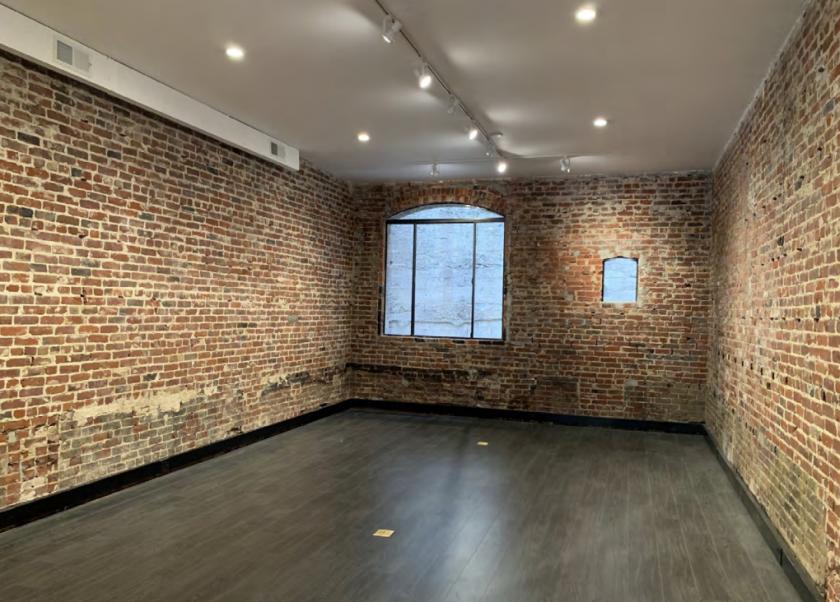
- • High Ceilings
- • Exposed Brick Walls
- • One 1 ADA Restroom
- • Potential Restaurant Opportunity
- • Great professional design space
Listing Agents

Remington Heatley
O: 415-229-8976
M: 650-430-1562
remington.heatley@kidder.com
O: 415-229-8976
M: 650-430-1562
remington.heatley@kidder.com
While we strive to provide the most accurate information, all listing information, and demographic data, is provided by third-parties. As such, MyEListing will not be responsible for the accuracy of the information. It is strongly recommended that you verify all information with the listing agent, and any relevant agencies, prior to making any decisions.