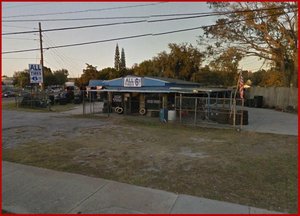
1-Mile | 3-Miles | 5-Miles | ||
---|---|---|---|---|
Total Population | 8,933 | 67,641 | 162,599 | |
Population Median Age | 37 | 38 | 38 | |
Population by Age | 0-9 Yrs | 1233 (13%) | 9036 (13%) | 21709 (13%) |
10-19 Yrs | 1153 (12%) | 8951 (13%) | 21007 (12%) | |
20-29 Yrs | 1346 (15%) | 9054 (13%) | 21613 (13%) | |
30-39 Yrs | 1321 (14%) | 9395 (13%) | 22563 (13%) | |
40-49 Yrs | 1073 (12%) | 9291 (13%) | 23079 (14%) | |
50-59 Yrs | 1304 (14%) | 8943 (13%) | 22283 (13%) | |
60-69 Yrs | 760 (8%) | 6863 (10%) | 16758 (10%) | |
70+ Yrs | 744 (8%) | 6107 (9%) | 13586 (8%) | |
Median HH Income | $41,336 | $58,145 | $61,648 | |
Total Household Income | < 24K | 831 (26%) | 3640 (16%) | 8025 (14%) |
25-49K | 1083 (34%) | 5772 (25%) | 13497 (24%) | |
50-74K | 643 (20%) | 4458 (19%) | 10843 (19%) | |
75-99K | 294 (9%) | 3119 (13%) | 8548 (15%) | |
100-199K | 210 (6%) | 4320 (19%) | 11171 (20%) | |
200K+ | 85 (2%) | 992 (4%) | 2880 (5%) | |
Highest Education Level | No Diploma | 1368 | 7081 | 12353 |
Diploma or GED | 2122 | 13088 | 29246 | |
Some College | 1026 | 9120 | 22514 | |
Assoc. Degree | 508 | 4288 | 12374 | |
Bachelors Degree | 660 | 8178 | 22978 | |
Higher Degree | 214 | 3551 | 10401 | |
Total Housing Units | 3,441 | 24,068 | 59,549 | |
--Owner-Occupied | 1,798 | 15,792 | 38,626 | |
--Renter-Occupied | 1,347 | 6,509 | 16,337 | |
Owner-Occupied Values | < 100K | 591 | 2276 | 5187 |
100-199K | 723 | 5172 | 11394 | |
200-299K | 358 | 5493 | 13208 | |
300-399K | 83 | 1889 | 5435 | |
400-499K | 8 | 523 | 1729 | |
500K+ | 34 | 440 | 1671 | |
Total Working Age Population | 6,938 | 52,850 | 127,325 | |
In Work Force | 4,326 | 34,288 | 85,241 | |
Not In Work Force | 2,613 | 18,562 | 42,085 | |
Workforce Employed | 4,079 | 32,356 | 80,614 | |
Workforce Unemployed | 247 | 1,915 | 4,515 | |
Civlian Workforce | 4,326 | 34,272 | 85,129 | |
Military Workforce | 0 | 17 | 112 | |
Total Households | 3,145 | 22,301 | 54,964 | |
Family Households | 1,940 | 15,875 | 39,203 | |
Non-Family Households | 1,205 | 6,426 | 15,760 | |
Married Couple | 1,142 | 11,041 | 27,900 | |
Other Family | 798 | 4,834 | 11,303 | |
Married w/Child | 481 | 4,372 | 11,656 | |
Single Male w/Child | 133 | 732 | 1,702 | |
Single Female w/Child | 336 | 1,932 | 4,146 |
Population Change Last Two Decades - Plus Projection
2000 | % | 2010 | % | 2020 | % | 2030 | |
---|---|---|---|---|---|---|---|
Florida | 15,982,378 | +18 | 18,801,310 | +14 | 21,517,610 | +13 | 24,340,457 |
Lake County | 210,528 | +41 | 297,052 | +21 | 360,739 | +21 | 437,201 |
Orange County | 896,344 | +28 | 1,145,956 | +24 | 1,415,511 | +20 | 1,693,977 |
Seminole County | 365,196 | +16 | 422,718 | +13 | 477,792 | +12 | 533,481 |
Volusia County | 443,343 | +12 | 494,593 | +10 | 544,093 | +9 | 594,289 |
Total Working Age Population:
Total Households:
Total Working Age Population:
Total Households:
Total Working Age Population:
Total Households: