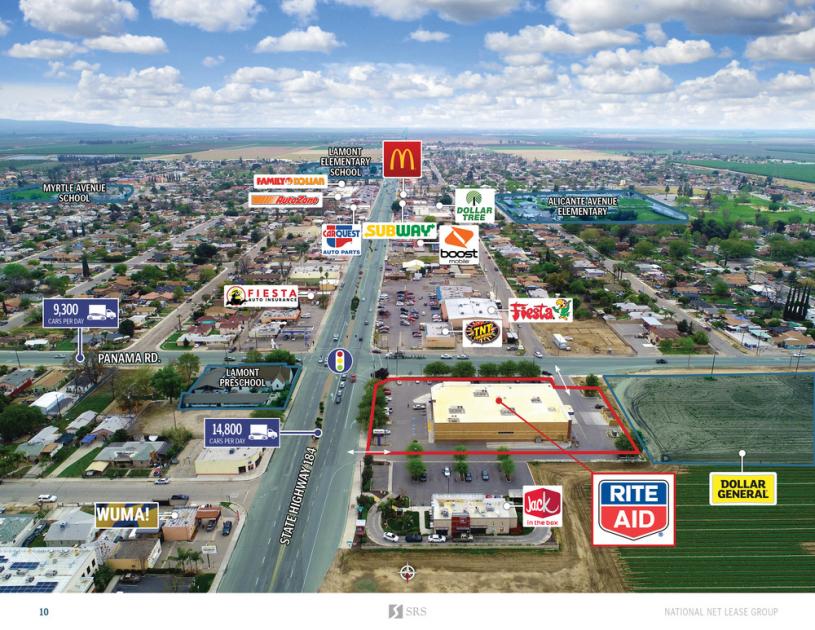
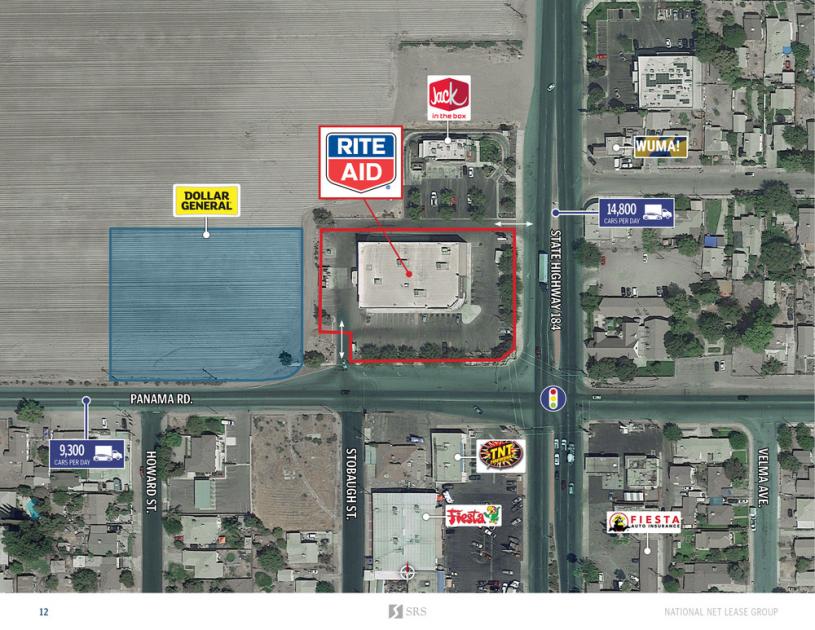
SRS National Net Lease Group is pleased to offer the opportunity to acquire the fee simple interest (land & building ownership) in an NNN leased, corporate guaranteed, drive-thru equipped, Rite Aid investment property located in Lamont, California. Rite Aid has 6.5 years remaining in their initial term with 6 (5-year) options to extend, demonstrating their commitment to the site. The lease is corporate guaranteed and is NNN with landlord responsibilities limited to roof and structure, making it an ideal low-management investment for a passive investor. Founded in 1962, Rite Aid now operates approximately 2,400 stores in 18 states, becoming the third largest drugstore chain in the U.S.Rite Aid is strategically located at the signalized, hard corner intersection of Panama Road and State Highway 184, averaging 24,100 combined vehicles passing by daily. The building is complete with a drive-thru pharmacy, providing ease and convenience for customers. On average, stores with drive-thrus experience higher sales than those without. The site is equipped with a large monument sign along Panama Road and a large pylon sign along State Highway 184, creating excellent visibility. The property benefits from direct access to State Highway 184 (14,800 VPD), a major north/south commuter thoroughfare serving the local agricultural community and the city of Lamont. Moreover, State Highway 184 serves as the primary retail corridor for the trade area with other nearby national/credit tenants including Dollar Tree, AutoZone, McDonald’s, Family Dollar, and more. Furthermore, there is extremely limited competition in the surrounding 5-mile area with Rite Aid being one of the primary drug store options for the city of Lamont. Additionally, the site is surrounded by several apartment complexes including Lamont Family Apartments (64 units), Rancho Lindo (44 units), Vintage Apartments (48 units), and Hallmark Apartments (48 units), providing a direct residential consumer base from which to draw. The 5-mile trade area is supported by more than 65,000 residents and 52,000 daytime employees with an average household income of over $58,000.