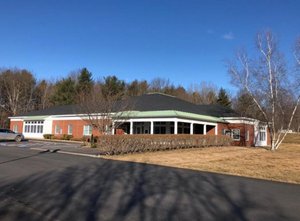
1-Mile | 3-Miles | 5-Miles | ||
---|---|---|---|---|
Total Population | 3,139 | 17,734 | 29,590 | |
Population Median Age | 41 | 44 | 43 | |
Population by Age | 0-9 Yrs | 392 (12%) | 1697 (9%) | 3002 (10%) |
10-19 Yrs | 264 (8%) | 1565 (8%) | 2784 (9%) | |
20-29 Yrs | 459 (14%) | 2525 (14%) | 4124 (13%) | |
30-39 Yrs | 458 (14%) | 2043 (11%) | 3277 (11%) | |
40-49 Yrs | 364 (11%) | 2023 (11%) | 3793 (12%) | |
50-59 Yrs | 347 (11%) | 2477 (13%) | 4075 (13%) | |
60-69 Yrs | 385 (12%) | 2481 (13%) | 4011 (13%) | |
70+ Yrs | 468 (14%) | 2924 (16%) | 4526 (15%) | |
Median HH Income | $43,791 | $40,593 | $45,041 | |
Total Household Income | < 24K | 423 (30%) | 2723 (31%) | 3921 (28%) |
25-49K | 302 (21%) | 2112 (24%) | 3387 (24%) | |
50-74K | 282 (20%) | 1438 (16%) | 2349 (17%) | |
75-99K | 137 (9%) | 806 (9%) | 1697 (12%) | |
100-199K | 200 (14%) | 1197 (14%) | 1988 (14%) | |
200K+ | 38 (2%) | 250 (2%) | 462 (3%) | |
Highest Education Level | No Diploma | 223 | 1373 | 2148 |
Diploma or GED | 681 | 4116 | 6941 | |
Some College | 344 | 2422 | 4195 | |
Assoc. Degree | 200 | 1236 | 1944 | |
Bachelors Degree | 488 | 2676 | 4176 | |
Higher Degree | 265 | 1347 | 2225 | |
Total Housing Units | 1,469 | 9,560 | 15,443 | |
--Owner-Occupied | 645 | 3,980 | 7,605 | |
--Renter-Occupied | 736 | 4,545 | 6,199 | |
Owner-Occupied Values | < 100K | 156 | 756 | 1463 |
100-199K | 364 | 2308 | 4324 | |
200-299K | 95 | 624 | 1198 | |
300-399K | 17 | 194 | 362 | |
400-499K | 13 | 51 | 128 | |
500K+ | 1 | 47 | 131 | |
Total Working Age Population | 2,614 | 15,126 | 25,009 | |
In Work Force | 1,453 | 8,604 | 14,990 | |
Not In Work Force | 1,161 | 6,522 | 10,019 | |
Workforce Employed | 1,399 | 8,126 | 14,163 | |
Workforce Unemployed | 54 | 453 | 752 | |
Civlian Workforce | 1,453 | 8,580 | 14,915 | |
Military Workforce | 0 | 24 | 75 | |
Total Households | 1,382 | 8,525 | 13,804 | |
Family Households | 691 | 3,714 | 6,789 | |
Non-Family Households | 691 | 4,812 | 7,014 | |
Married Couple | 406 | 2,444 | 4,593 | |
Other Family | 285 | 1,269 | 2,196 | |
Married w/Child | 133 | 717 | 1,315 | |
Single Male w/Child | 43 | 165 | 283 | |
Single Female w/Child | 161 | 677 | 1,079 |
Population Change Last Two Decades - Plus Projection
2000 | % | 2010 | % | 2020 | % | 2030 | |
---|---|---|---|---|---|---|---|
Maine | 1,274,923 | +4 | 1,328,361 | +1 | 1,335,260 | 0 | 1,341,046 |
Kennebec County | 117,114 | +4 | 122,151 | -1 | 120,469 | -1 | 119,468 |
Lincoln County | 33,616 | +3 | 34,457 | -5 | 32,801 | -7 | 30,651 |
Total Working Age Population:
Total Households:
Total Working Age Population:
Total Households:
Total Working Age Population:
Total Households: