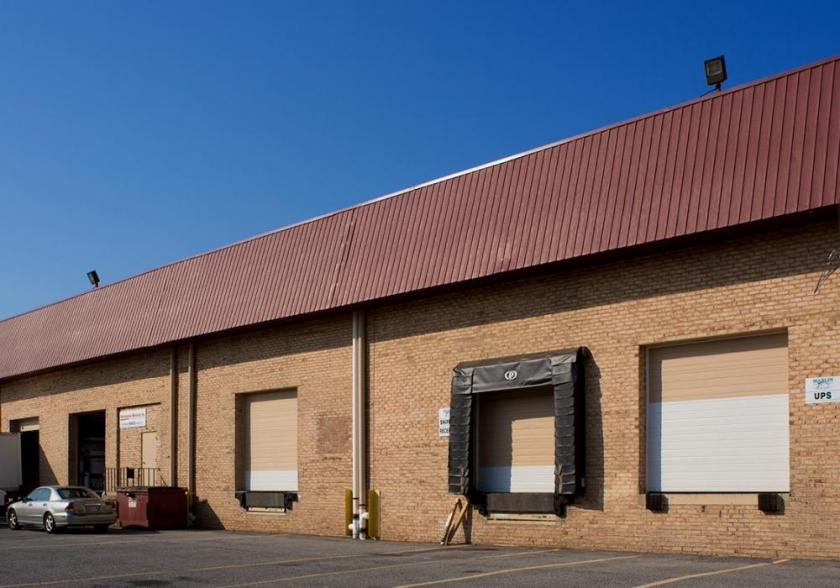
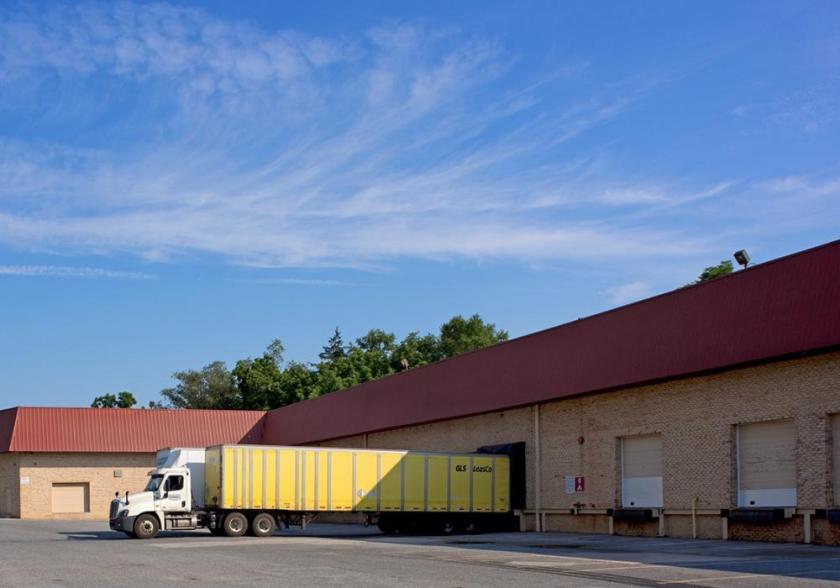
1-Mile | 3-Miles | 5-Miles | ||
---|---|---|---|---|
Total Population | 13,691 | 153,408 | 435,686 | |
Population Median Age | 34 | 36 | 37 | |
Population by Age | 0-9 Yrs | 2552 (18%) | 20567 (13%) | 52958 (12%) |
10-19 Yrs | 1898 (13%) | 16511 (10%) | 45223 (10%) | |
20-29 Yrs | 1928 (14%) | 27423 (17%) | 80471 (18%) | |
30-39 Yrs | 2237 (16%) | 27347 (17%) | 76543 (17%) | |
40-49 Yrs | 1251 (9%) | 15460 (10%) | 46419 (10%) | |
50-59 Yrs | 1632 (11%) | 19053 (12%) | 54647 (12%) | |
60-69 Yrs | 1222 (8%) | 14784 (9%) | 43889 (10%) | |
70+ Yrs | 970 (7%) | 12262 (7%) | 35536 (8%) | |
Median HH Income | $39,030 | $50,973 | $54,455 | |
Total Household Income | < 24K | 1623 (32%) | 16966 (27%) | 45715 (26%) |
25-49K | 1290 (25%) | 13425 (21%) | 36538 (20%) | |
50-74K | 852 (16%) | 9674 (15%) | 27744 (15%) | |
75-99K | 586 (11%) | 6831 (11%) | 19175 (10%) | |
100-199K | 591 (11%) | 10753 (17%) | 33661 (19%) | |
200K+ | 104 (2%) | 3906 (6%) | 12442 (7%) | |
Highest Education Level | No Diploma | 1933 | 18259 | 45590 |
Diploma or GED | 3129 | 32686 | 88285 | |
Some College | 1761 | 18776 | 55835 | |
Assoc. Degree | 398 | 5182 | 15555 | |
Bachelors Degree | 762 | 17699 | 56478 | |
Higher Degree | 552 | 13913 | 46026 | |
Total Housing Units | 5,975 | 77,926 | 218,249 | |
--Owner-Occupied | 1,952 | 26,511 | 81,205 | |
--Renter-Occupied | 3,093 | 35,044 | 94,069 | |
Owner-Occupied Values | < 100K | 892 | 7141 | 17699 |
100-199K | 755 | 7679 | 21922 | |
200-299K | 179 | 5779 | 21292 | |
300-399K | 82 | 2783 | 10252 | |
400-499K | 43 | 1188 | 4592 | |
500K+ | 2 | 1941 | 5449 | |
Total Working Age Population | 9,842 | 122,082 | 355,655 | |
In Work Force | 6,224 | 78,685 | 229,061 | |
Not In Work Force | 3,618 | 43,398 | 126,594 | |
Workforce Employed | 5,567 | 72,990 | 212,285 | |
Workforce Unemployed | 647 | 5,505 | 16,010 | |
Civlian Workforce | 6,214 | 78,495 | 228,295 | |
Military Workforce | 10 | 190 | 767 | |
Total Households | 5,045 | 61,555 | 175,274 | |
Family Households | 3,106 | 31,299 | 86,699 | |
Non-Family Households | 1,940 | 30,256 | 88,574 | |
Married Couple | 1,315 | 15,240 | 44,607 | |
Other Family | 1,791 | 16,060 | 42,092 | |
Married w/Child | 499 | 5,332 | 15,440 | |
Single Male w/Child | 92 | 1,253 | 3,359 | |
Single Female w/Child | 950 | 6,587 | 16,287 |
Population Change Last Two Decades - Plus Projection
2000 | % | 2010 | % | 2020 | % | 2030 | |
---|---|---|---|---|---|---|---|
Maryland | 5,296,486 | +9 | 5,773,552 | +6 | 6,141,900 | +6 | 6,518,750 |
Anne Arundel County | 489,656 | +10 | 537,656 | +7 | 573,250 | +4 | 596,700 |
Baltimore County | 754,292 | +7 | 805,029 | +5 | 847,000 | +2 | 862,200 |
Harford County | 218,590 | +12 | 244,826 | +5 | 257,700 | +5 | 271,850 |
Howard County | 247,842 | +16 | 287,085 | +17 | 336,900 | +9 | 366,800 |
Baltimore city | 651,154 | -5 | 620,961 | -1 | 616,300 | +1 | 625,100 |
Total Working Age Population:
Total Households:
Total Working Age Population:
Total Households:
Total Working Age Population:
Total Households: