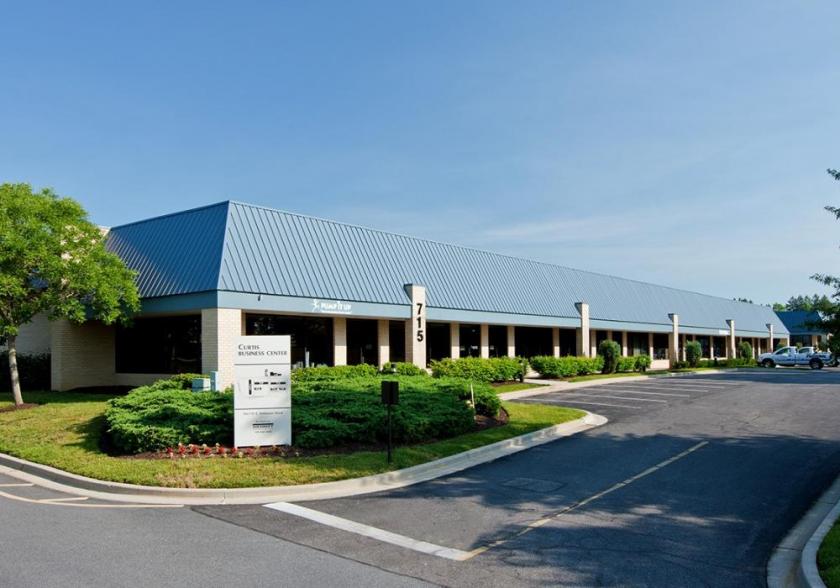
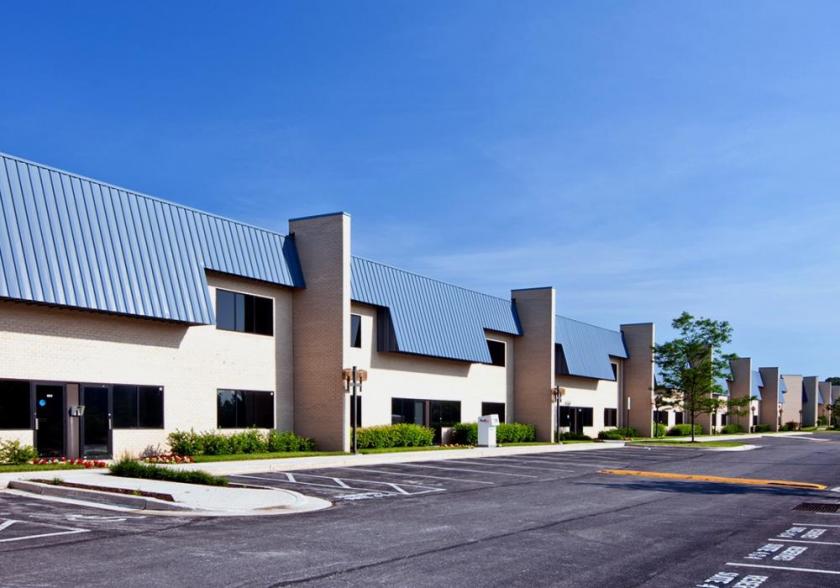
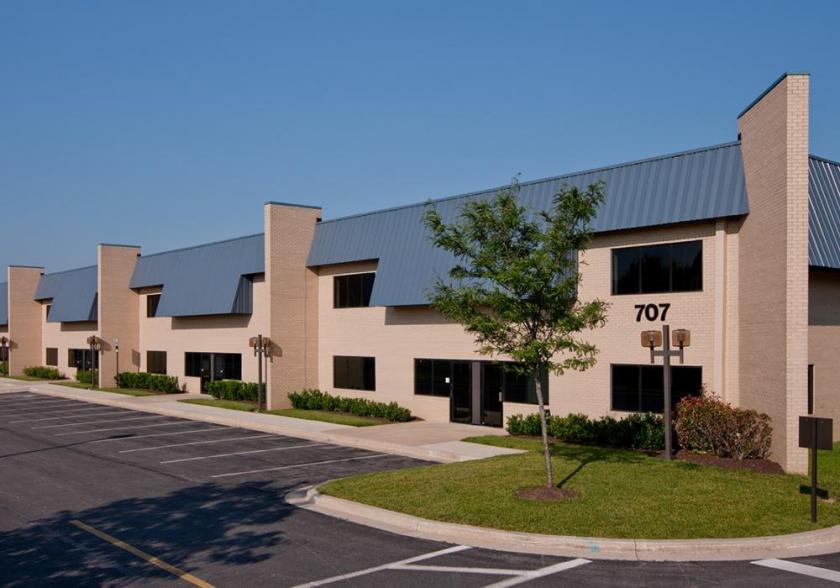
1-Mile | 3-Miles | 5-Miles | ||
---|---|---|---|---|
Total Population | 3,157 | 67,296 | 186,770 | |
Population Median Age | 40 | 38 | 37 | |
Population by Age | 0-9 Yrs | 311 (9%) | 9277 (13%) | 25378 (13%) |
10-19 Yrs | 264 (8%) | 7054 (10%) | 21452 (11%) | |
20-29 Yrs | 610 (19%) | 9456 (14%) | 29279 (15%) | |
30-39 Yrs | 464 (14%) | 10793 (16%) | 30524 (16%) | |
40-49 Yrs | 429 (13%) | 8092 (12%) | 21589 (11%) | |
50-59 Yrs | 346 (10%) | 9406 (13%) | 24453 (13%) | |
60-69 Yrs | 308 (9%) | 6609 (9%) | 17772 (9%) | |
70+ Yrs | 424 (13%) | 6607 (9%) | 16323 (8%) | |
Median HH Income | $68,973 | $66,000 | $70,462 | |
Total Household Income | < 24K | 187 (15%) | 4307 (17%) | 11451 (16%) |
25-49K | 238 (19%) | 5314 (21%) | 13868 (19%) | |
50-74K | 269 (21%) | 4533 (18%) | 12111 (17%) | |
75-99K | 153 (12%) | 3982 (15%) | 10049 (14%) | |
100-199K | 358 (28%) | 5760 (22%) | 17908 (25%) | |
200K+ | 41 (3%) | 1282 (5%) | 5050 (7%) | |
Highest Education Level | No Diploma | 294 | 7207 | 17543 |
Diploma or GED | 784 | 17457 | 43618 | |
Some College | 569 | 10503 | 25327 | |
Assoc. Degree | 165 | 3308 | 8772 | |
Bachelors Degree | 378 | 5361 | 20443 | |
Higher Degree | 118 | 2793 | 12148 | |
Total Housing Units | 1,389 | 28,254 | 78,001 | |
--Owner-Occupied | 924 | 16,680 | 43,776 | |
--Renter-Occupied | 322 | 8,498 | 26,661 | |
Owner-Occupied Values | < 100K | 50 | 1955 | 3865 |
100-199K | 433 | 3984 | 8481 | |
200-299K | 386 | 7360 | 17886 | |
300-399K | 39 | 2528 | 8751 | |
400-499K | 8 | 523 | 2658 | |
500K+ | 8 | 329 | 2134 | |
Total Working Age Population | 2,663 | 53,628 | 148,135 | |
In Work Force | 1,580 | 35,333 | 101,700 | |
Not In Work Force | 1,083 | 18,295 | 46,435 | |
Workforce Employed | 1,459 | 32,696 | 95,223 | |
Workforce Unemployed | 85 | 2,224 | 5,545 | |
Civlian Workforce | 1,544 | 34,919 | 100,767 | |
Military Workforce | 35 | 414 | 932 | |
Total Households | 1,246 | 25,178 | 70,436 | |
Family Households | 684 | 15,920 | 44,361 | |
Non-Family Households | 561 | 9,258 | 26,076 | |
Married Couple | 403 | 9,954 | 27,996 | |
Other Family | 281 | 5,966 | 16,365 | |
Married w/Child | 154 | 4,138 | 11,181 | |
Single Male w/Child | 24 | 721 | 1,734 | |
Single Female w/Child | 91 | 1,820 | 5,868 |
Population Change Last Two Decades - Plus Projection
2000 | % | 2010 | % | 2020 | % | 2030 | |
---|---|---|---|---|---|---|---|
Maryland | 5,296,486 | +9 | 5,773,552 | +6 | 6,141,900 | +6 | 6,518,750 |
Anne Arundel County | 489,656 | +10 | 537,656 | +7 | 573,250 | +4 | 596,700 |
Baltimore County | 754,292 | +7 | 805,029 | +5 | 847,000 | +2 | 862,200 |
Harford County | 218,590 | +12 | 244,826 | +5 | 257,700 | +5 | 271,850 |
Baltimore city | 651,154 | -5 | 620,961 | -1 | 616,300 | +1 | 625,100 |
Total Working Age Population:
Total Households:
Total Working Age Population:
Total Households:
Total Working Age Population:
Total Households: