Office Space
121 Rand Road Lakemoor, IL 60051
121 Rand Road Lakemoor, IL 60051

Details & Description
Property Highlights
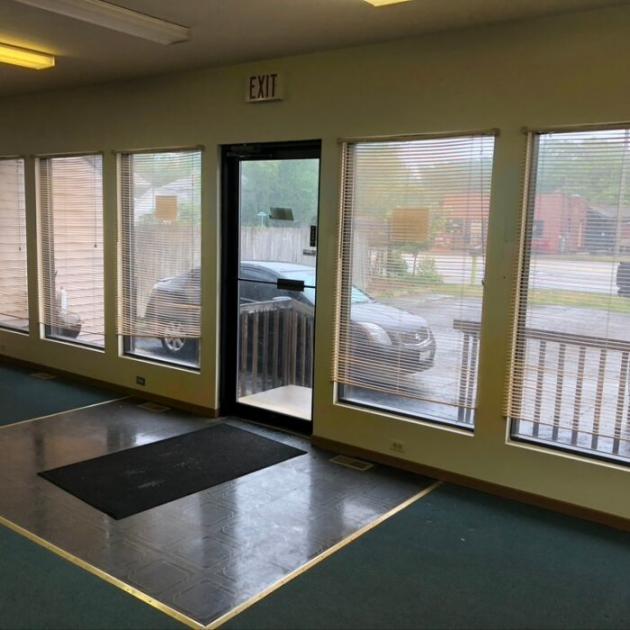
• Office or Retail Use
• Office or Retail Use
Listing Agents

Brian Cowell
O: 847-854-2300
M: 815-529-7890
brianc@premiercommercialrealty.com
O: 847-854-2300
M: 815-529-7890
brianc@premiercommercialrealty.com

Jean Lino
Premier Commercial Realty
O: 847-854-2300
jeanl@premiercommercialrealty.com
Premier Commercial Realty
O: 847-854-2300
jeanl@premiercommercialrealty.com
While we strive to provide the most accurate information, all listing information, and demographic data, is provided by third-parties. As such, MyEListing will not be responsible for the accuracy of the information. It is strongly recommended that you verify all information with the listing agent, and any relevant agencies, prior to making any decisions.