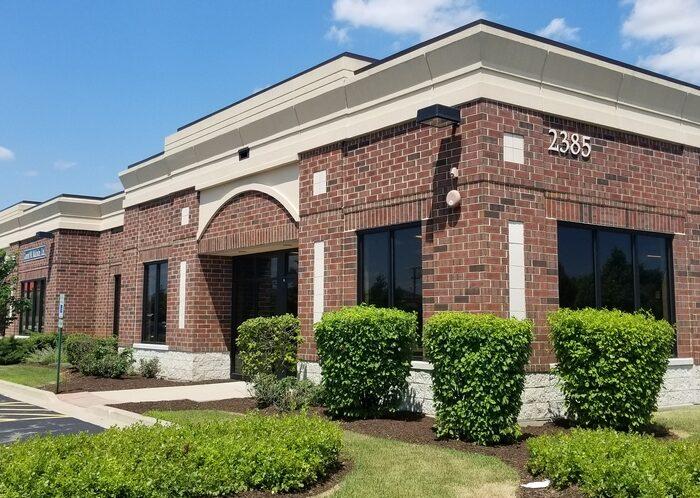
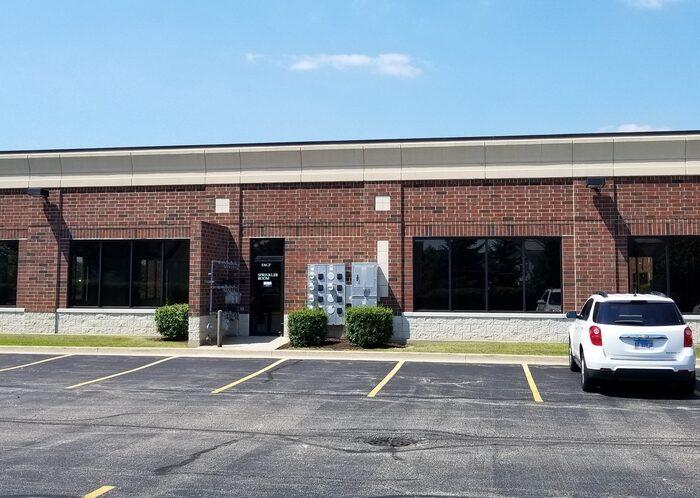
Office Space
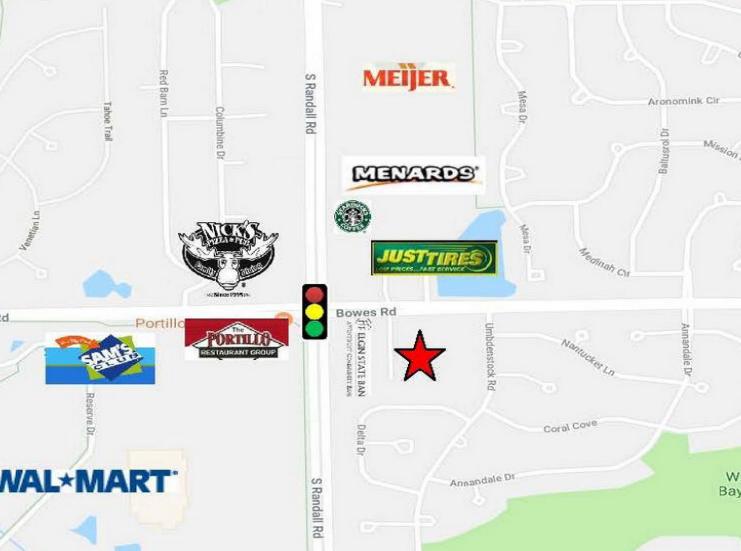
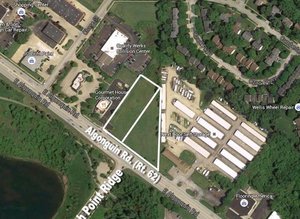
2385 Bowes Road Elgin, IL 60123
2385 Bowes Road Elgin, IL 60123
Details & Description
Property Highlights
- • Year Built 2007
- • HVAC System GFA / Central Air
- • Electrical 100-200 AMP
- • Sprinkled Yes
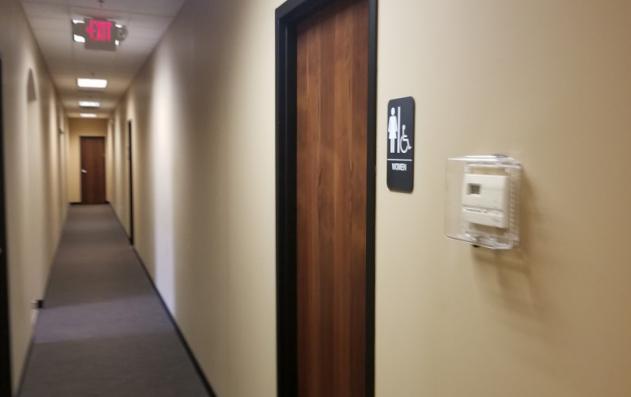
- • Washrooms Common
- • Ceiling Height 12’
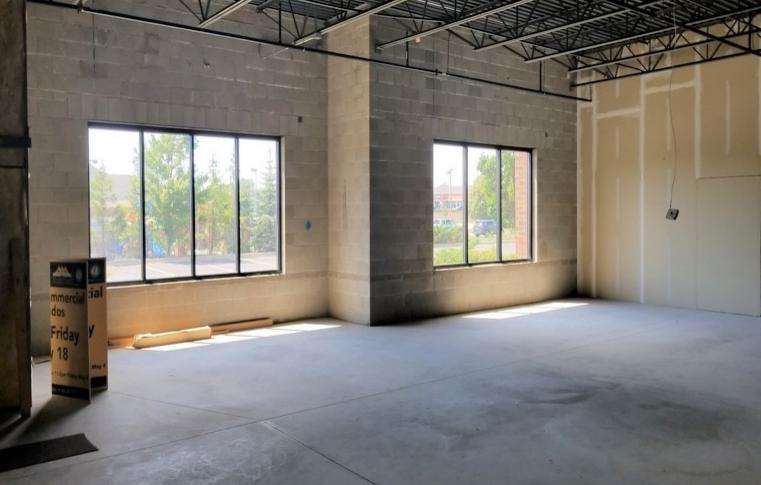
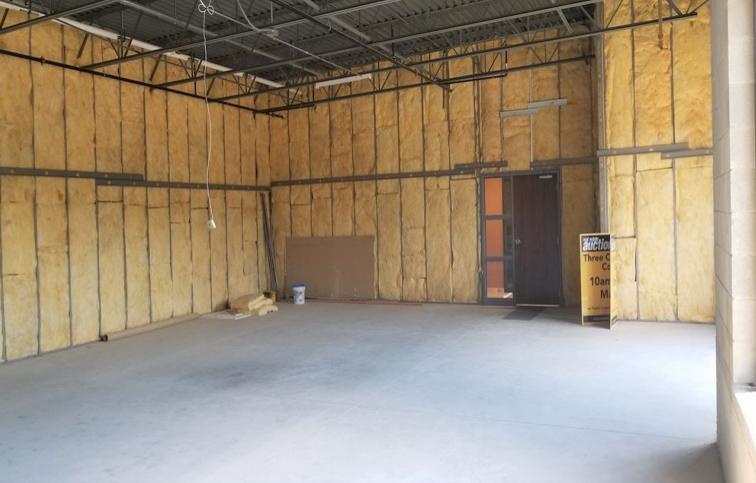
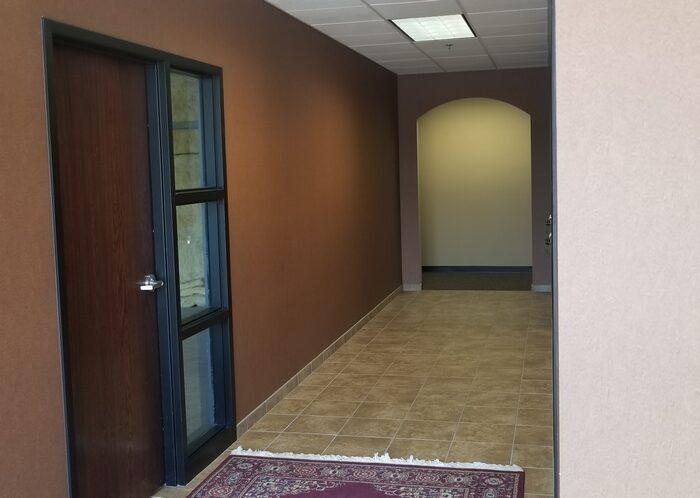
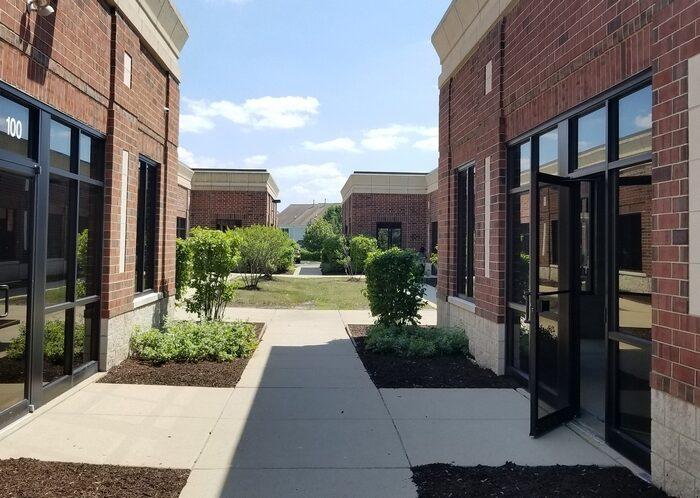
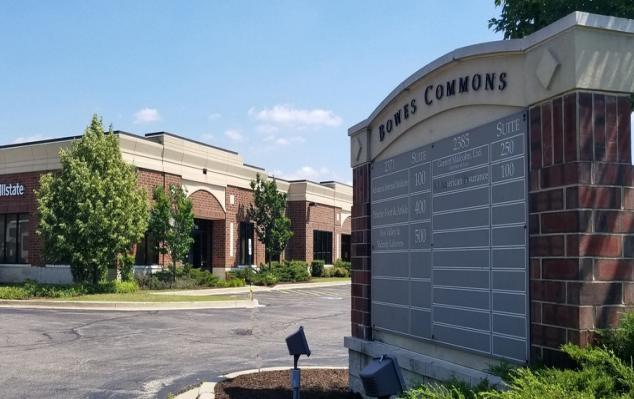
Additional Photos
Listing Agents

Heather Schweitzer
O: 847-854-2300
M: 815-236-9816
heathers@premiercommercialrealty.com
O: 847-854-2300
M: 815-236-9816
heathers@premiercommercialrealty.com
While we strive to provide the most accurate information, all listing information, and demographic data, is provided by third-parties. As such, MyEListing will not be responsible for the accuracy of the information. It is strongly recommended that you verify all information with the listing agent, and any relevant agencies, prior to making any decisions.