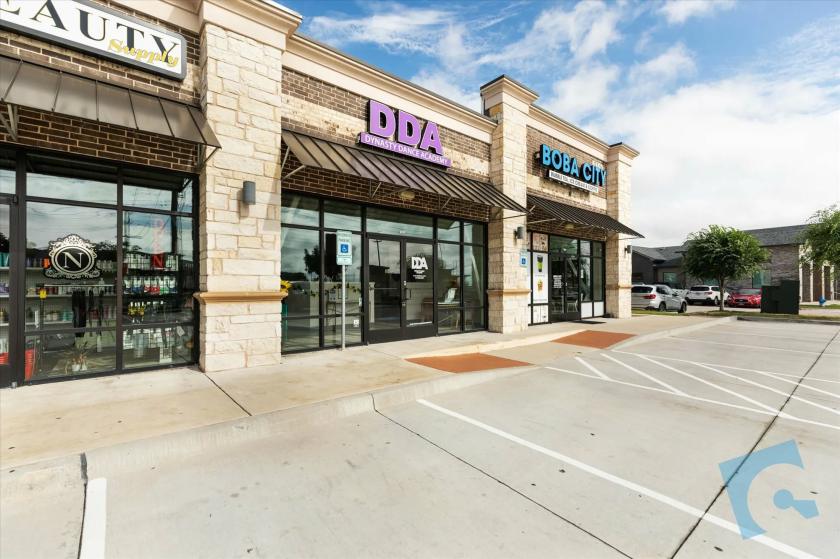
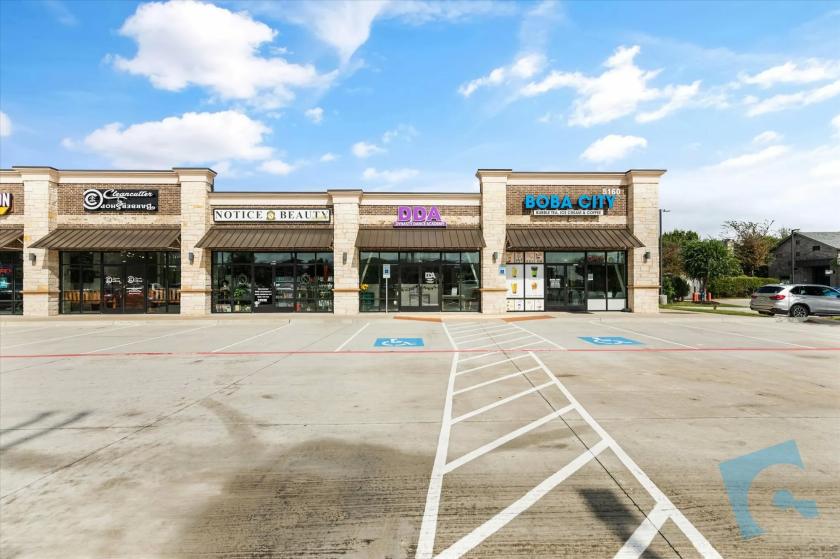
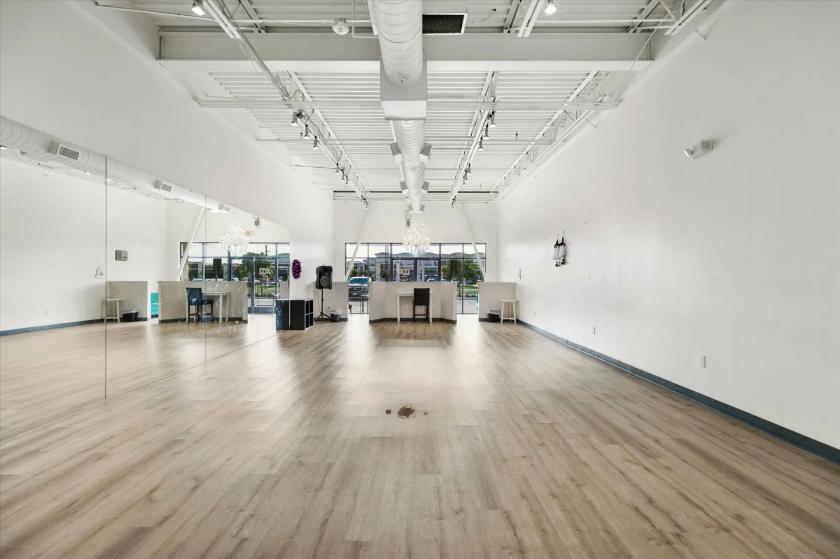
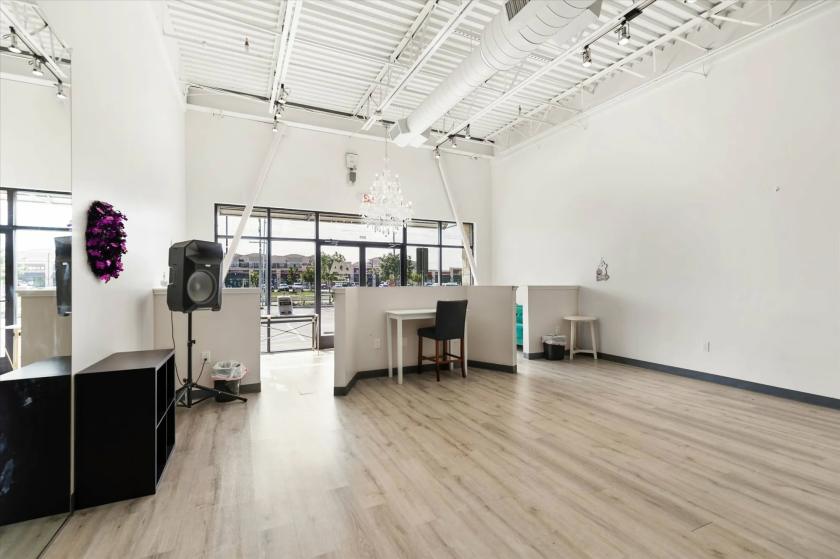
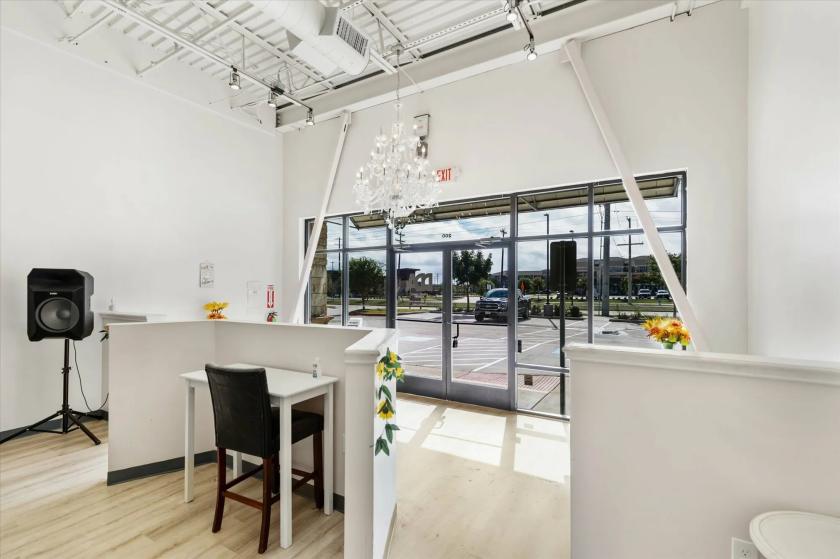
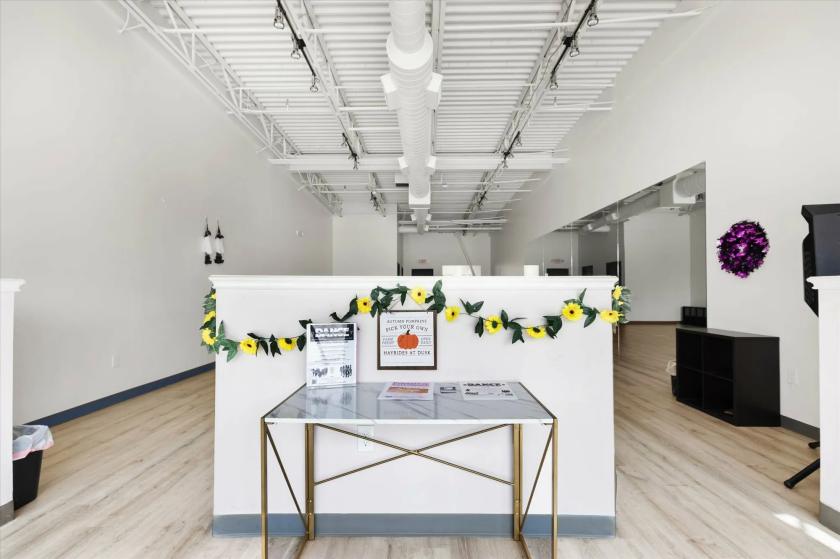
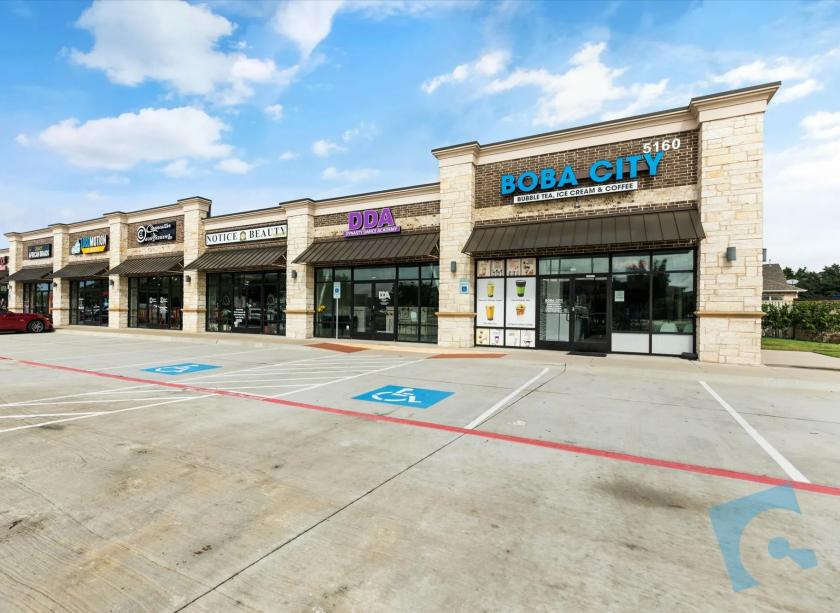
Retail Space
5160 Collin McKinney Parkway McKinney, TX 75070
5160 Collin McKinney Parkway McKinney, TX 75070
Details & Description
Property Highlights
- • Newer Construction Retail Center
- • Lease Rate: $29.00 - 30.00 SF/yr
- • Move-In Ready (12/15/2023)
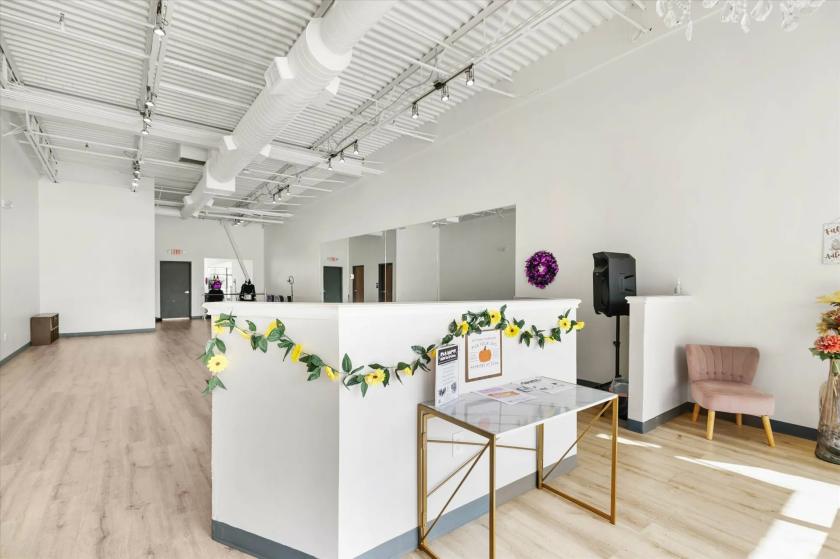
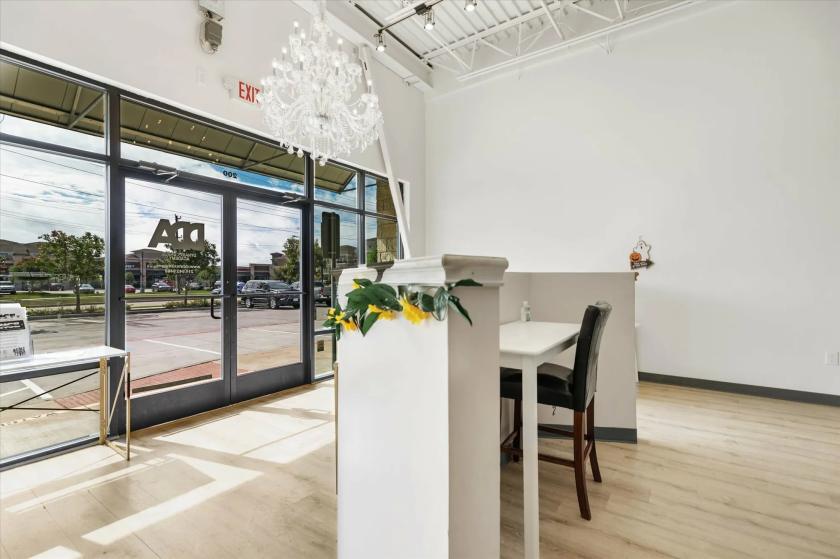
- • Retail/Office Space
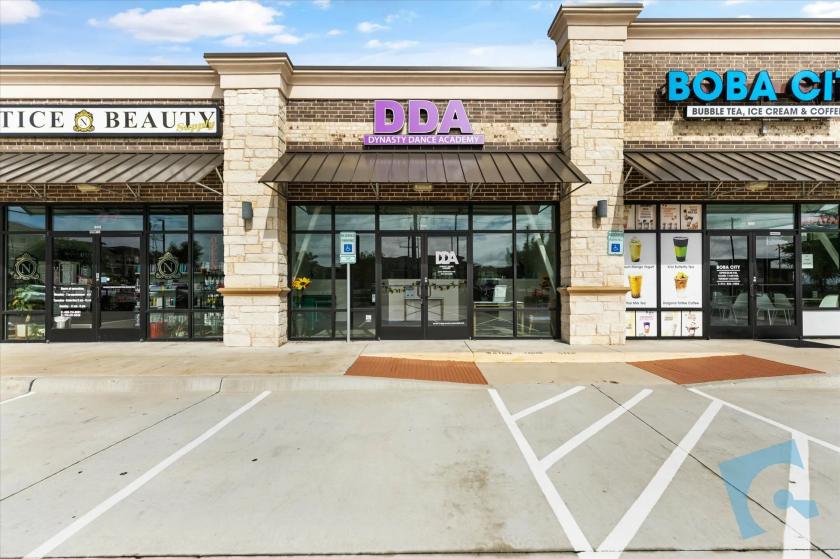
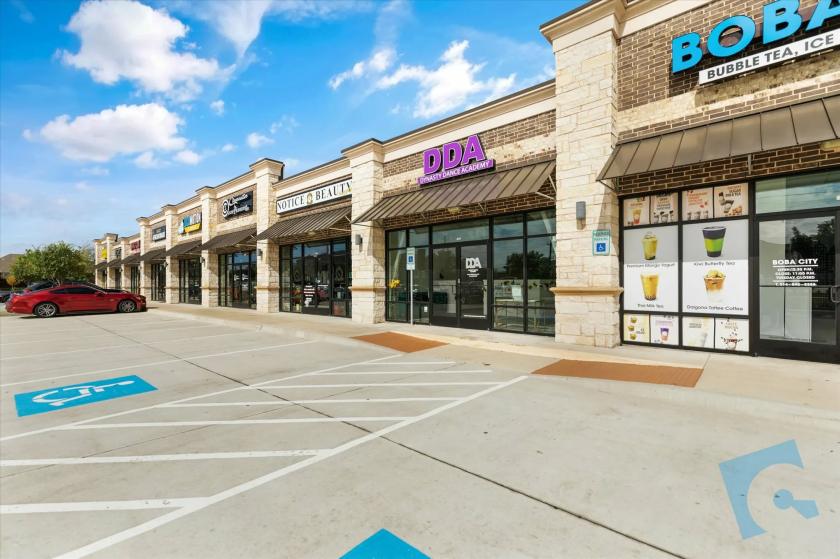
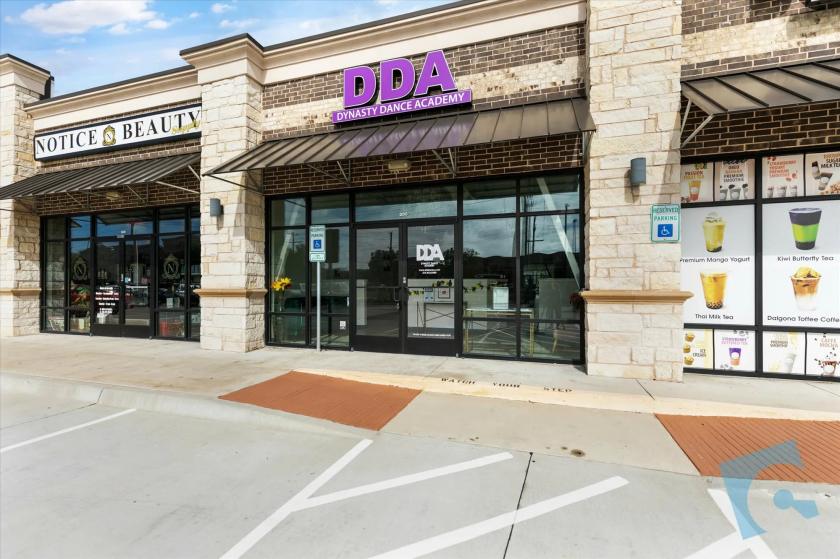
Additional Photos

Listing Agents

Gary Price
O: 817-488-4333
gary@championsdfw.com
O: 817-488-4333
gary@championsdfw.com

Jim Kelley
O: 817-488-4333
M: 817-909-7875
jim@championsdfw.com
O: 817-488-4333
M: 817-909-7875
jim@championsdfw.com
While we strive to provide the most accurate information, all listing information, and demographic data, is provided by third-parties. As such, MyEListing will not be responsible for the accuracy of the information. It is strongly recommended that you verify all information with the listing agent, and any relevant agencies, prior to making any decisions.