Industrial Properties
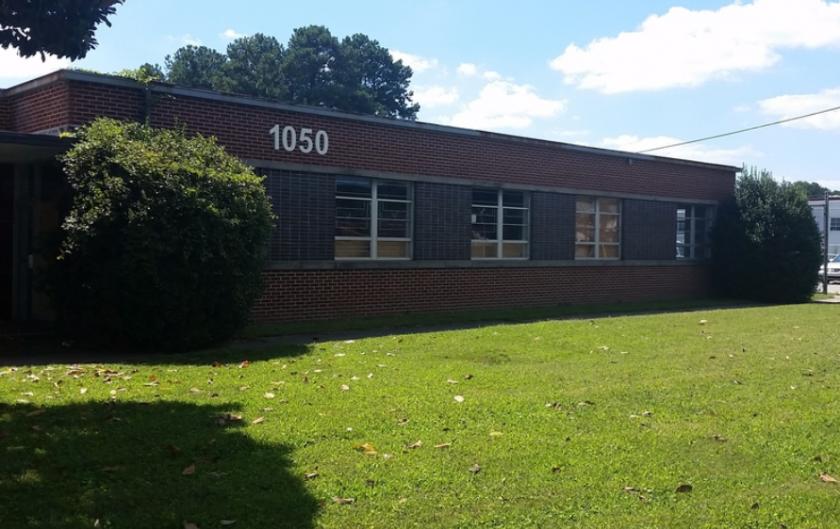
1050 Oakleigh Drive Atlanta, GA 30344
1050 Oakleigh Drive Atlanta, GA 30344
Details & Description
Property Highlights
- • Fenced, Lighted, Secured Truck Court
- • Abundant outdoor parking and storage
- • 20 x 30 Columns
- • Light Industrial Zoning
- • Dedicated Employee Parking
Listing Agents

Anil Vaswani
KW Commercial
O: 404-604-3333
M: 404-723-2645
anil@kwcommercial.com
KW Commercial
O: 404-604-3333
M: 404-723-2645
anil@kwcommercial.com
While we strive to provide the most accurate information, all listing information, and demographic data, is provided by third-parties. As such, MyEListing will not be responsible for the accuracy of the information. It is strongly recommended that you verify all information with the listing agent, and any relevant agencies, prior to making any decisions.


