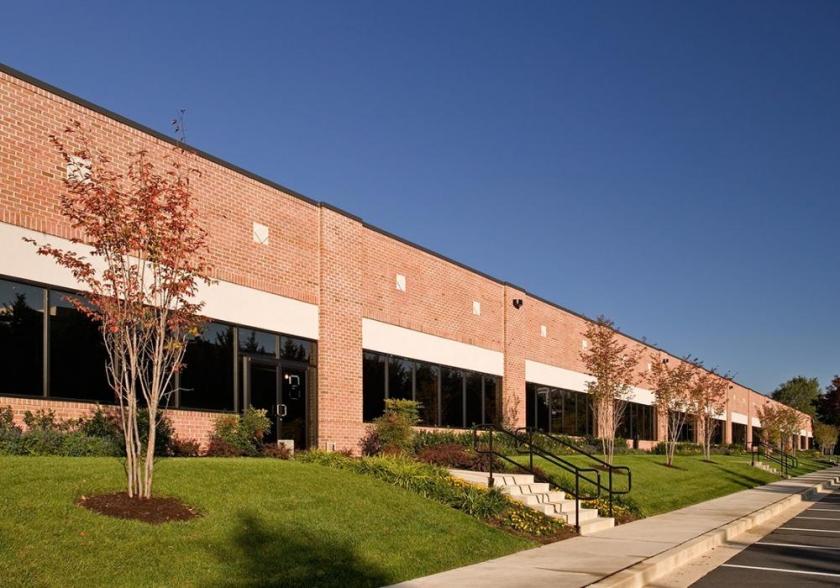
1-Mile | 3-Miles | 5-Miles | ||
---|---|---|---|---|
Total Population | 835 | 26,745 | 68,753 | |
Population Median Age | 51 | 42 | 42 | |
Population by Age | 0-9 Yrs | 48 (5%) | 2717 (10%) | 7864 (11%) |
10-19 Yrs | 53 (6%) | 2690 (10%) | 8177 (11%) | |
20-29 Yrs | 59 (7%) | 3780 (14%) | 7463 (10%) | |
30-39 Yrs | 130 (15%) | 3613 (13%) | 8273 (12%) | |
40-49 Yrs | 74 (8%) | 2800 (10%) | 8374 (12%) | |
50-59 Yrs | 108 (12%) | 3584 (13%) | 9934 (14%) | |
60-69 Yrs | 134 (16%) | 3601 (13%) | 9061 (13%) | |
70+ Yrs | 229 (27%) | 3959 (14%) | 9607 (13%) | |
Median HH Income | $85,014 | $77,728 | $93,041 | |
Total Household Income | < 24K | 67 (16%) | 1543 (13%) | 2864 (10%) |
25-49K | 61 (14%) | 2013 (16%) | 4039 (14%) | |
50-74K | 53 (12%) | 2203 (18%) | 4631 (16%) | |
75-99K | 58 (14%) | 1497 (12%) | 3344 (11%) | |
100-199K | 94 (23%) | 2982 (25%) | 7830 (28%) | |
200K+ | 75 (18%) | 1606 (13%) | 5187 (18%) | |
Highest Education Level | No Diploma | 20 | 833 | 2131 |
Diploma or GED | 110 | 3116 | 7009 | |
Some College | 118 | 3566 | 7668 | |
Assoc. Degree | 54 | 1266 | 2895 | |
Bachelors Degree | 215 | 6796 | 17007 | |
Higher Degree | 197 | 4512 | 13093 | |
Total Housing Units | 445 | 12,673 | 29,535 | |
--Owner-Occupied | 248 | 6,869 | 19,107 | |
--Renter-Occupied | 160 | 4,975 | 8,790 | |
Owner-Occupied Values | < 100K | 7 | 133 | 238 |
100-199K | 20 | 705 | 1068 | |
200-299K | 89 | 1622 | 2991 | |
300-399K | 34 | 1707 | 5252 | |
400-499K | 32 | 838 | 3276 | |
500K+ | 67 | 1865 | 6281 | |
Total Working Age Population | 764 | 22,192 | 55,653 | |
In Work Force | 433 | 14,847 | 37,149 | |
Not In Work Force | 332 | 7,345 | 18,504 | |
Workforce Employed | 430 | 14,489 | 36,093 | |
Workforce Unemployed | 1 | 355 | 1,053 | |
Civlian Workforce | 431 | 14,844 | 37,146 | |
Military Workforce | 1 | 3 | 3 | |
Total Households | 408 | 11,844 | 27,896 | |
Family Households | 177 | 6,451 | 17,739 | |
Non-Family Households | 232 | 5,393 | 10,157 | |
Married Couple | 159 | 5,220 | 14,729 | |
Other Family | 17 | 1,232 | 3,011 | |
Married w/Child | 39 | 1,912 | 6,045 | |
Single Male w/Child | 5 | 132 | 365 | |
Single Female w/Child | 8 | 508 | 1,060 |
Population Change Last Two Decades - Plus Projection
2000 | % | 2010 | % | 2020 | % | 2030 | |
---|---|---|---|---|---|---|---|
Maryland | 5,296,486 | +9 | 5,773,552 | +6 | 6,141,900 | +6 | 6,518,750 |
Baltimore County | 754,292 | +7 | 805,029 | +5 | 847,000 | +2 | 862,200 |
Harford County | 218,590 | +12 | 244,826 | +5 | 257,700 | +5 | 271,850 |
Total Working Age Population:
Total Households:
Total Working Age Population:
Total Households:
Total Working Age Population:
Total Households: