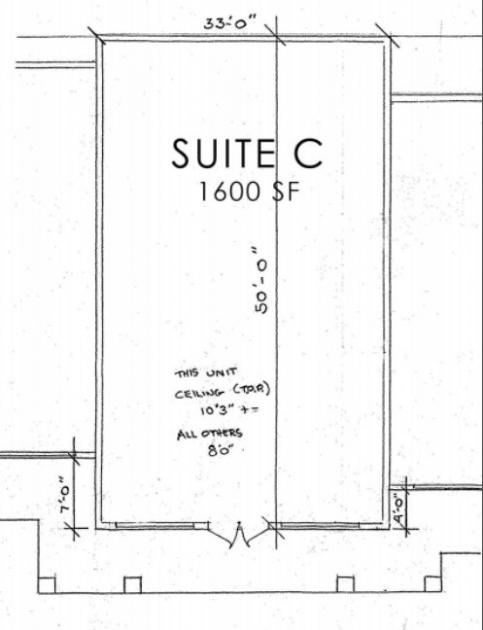
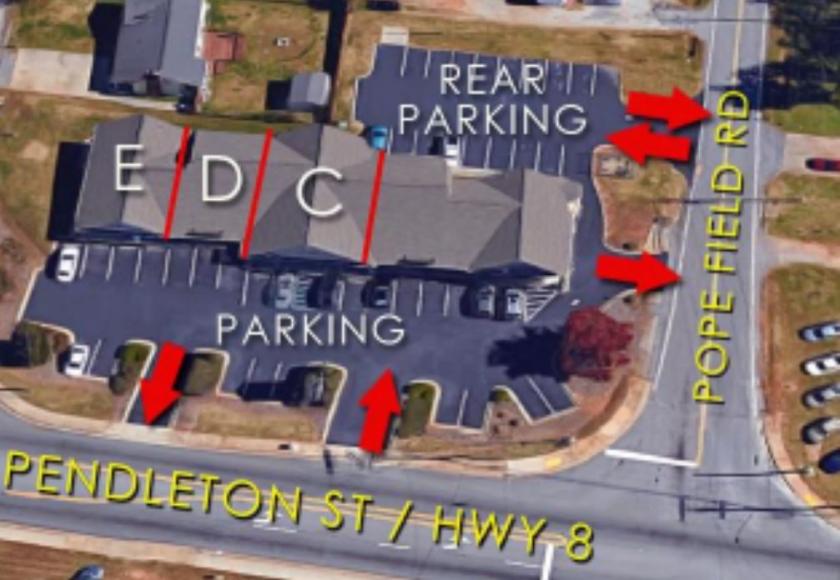
1-Mile | 3-Miles | 5-Miles | ||
---|---|---|---|---|
Total Population | 3,829 | 25,693 | 47,452 | |
Population Median Age | 39 | 40 | 40 | |
Population by Age | 0-9 Yrs | 576 (15%) | 3480 (13%) | 5894 (12%) |
10-19 Yrs | 406 (10%) | 2699 (10%) | 5580 (11%) | |
20-29 Yrs | 441 (11%) | 3318 (12%) | 5725 (12%) | |
30-39 Yrs | 523 (13%) | 3315 (12%) | 5990 (12%) | |
40-49 Yrs | 464 (12%) | 3079 (11%) | 6176 (13%) | |
50-59 Yrs | 482 (12%) | 3341 (13%) | 6395 (13%) | |
60-69 Yrs | 475 (12%) | 3134 (12%) | 5742 (12%) | |
70+ Yrs | 462 (12%) | 3327 (12%) | 5950 (12%) | |
Median HH Income | $42,146 | $49,768 | $55,287 | |
Total Household Income | < 24K | 408 (25%) | 2232 (21%) | 3771 (19%) |
25-49K | 503 (31%) | 3041 (28%) | 4916 (26%) | |
50-74K | 239 (15%) | 2105 (20%) | 3531 (18%) | |
75-99K | 179 (11%) | 1035 (9%) | 2416 (12%) | |
100-199K | 239 (15%) | 1828 (17%) | 3585 (19%) | |
200K+ | 5 (0%) | 257 (2%) | 647 (3%) | |
Highest Education Level | No Diploma | 558 | 3114 | 4964 |
Diploma or GED | 758 | 5282 | 9812 | |
Some College | 617 | 3669 | 6575 | |
Assoc. Degree | 239 | 1952 | 3862 | |
Bachelors Degree | 270 | 2282 | 5057 | |
Higher Degree | 186 | 1614 | 2854 | |
Total Housing Units | 1,733 | 11,565 | 20,559 | |
--Owner-Occupied | 870 | 6,700 | 13,632 | |
--Renter-Occupied | 703 | 3,798 | 5,234 | |
Owner-Occupied Values | < 100K | 268 | 1769 | 3206 |
100-199K | 440 | 3120 | 6129 | |
200-299K | 115 | 1109 | 2716 | |
300-399K | 19 | 340 | 947 | |
400-499K | 11 | 219 | 382 | |
500K+ | 17 | 144 | 251 | |
Total Working Age Population | 2,967 | 20,556 | 38,178 | |
In Work Force | 1,770 | 12,645 | 23,429 | |
Not In Work Force | 1,197 | 7,910 | 14,749 | |
Workforce Employed | 1,675 | 12,040 | 22,266 | |
Workforce Unemployed | 93 | 583 | 1,130 | |
Civlian Workforce | 1,768 | 12,623 | 23,396 | |
Military Workforce | 2 | 23 | 33 | |
Total Households | 1,573 | 10,498 | 18,865 | |
Family Households | 951 | 6,802 | 12,920 | |
Non-Family Households | 622 | 3,696 | 5,945 | |
Married Couple | 651 | 4,823 | 9,754 | |
Other Family | 301 | 1,979 | 3,166 | |
Married w/Child | 292 | 1,862 | 3,620 | |
Single Male w/Child | 51 | 362 | 522 | |
Single Female w/Child | 103 | 636 | 951 |
Population Change Last Two Decades - Plus Projection
2000 | % | 2010 | % | 2020 | % | 2030 | |
---|---|---|---|---|---|---|---|
South Carolina | 4,012,012 | +15 | 4,625,364 | +9 | 5,020,400 | +9 | 5,488,460 |
Anderson County | 165,740 | +13 | 187,126 | +8 | 201,730 | +8 | 218,520 |
Greenville County | 379,616 | +19 | 451,225 | +9 | 492,890 | +10 | 542,290 |
Pickens County | 110,757 | +8 | 119,224 | +14 | 135,920 | +11 | 150,420 |
Total Working Age Population:
Total Households:
Total Working Age Population:
Total Households:
Total Working Age Population:
Total Households: