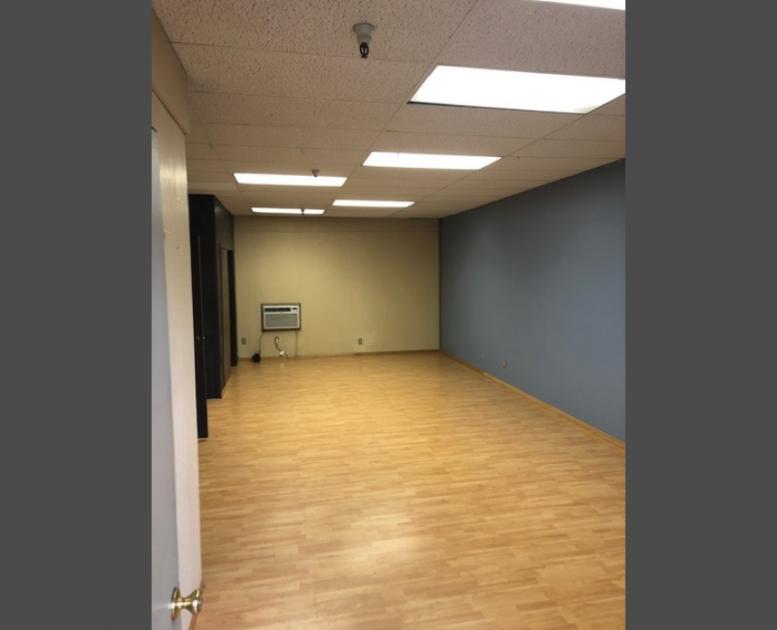
Office Space
2632 E Street Washougal, WA 98671
2632 E Street Washougal, WA 98671

Details & Description
Property Highlights
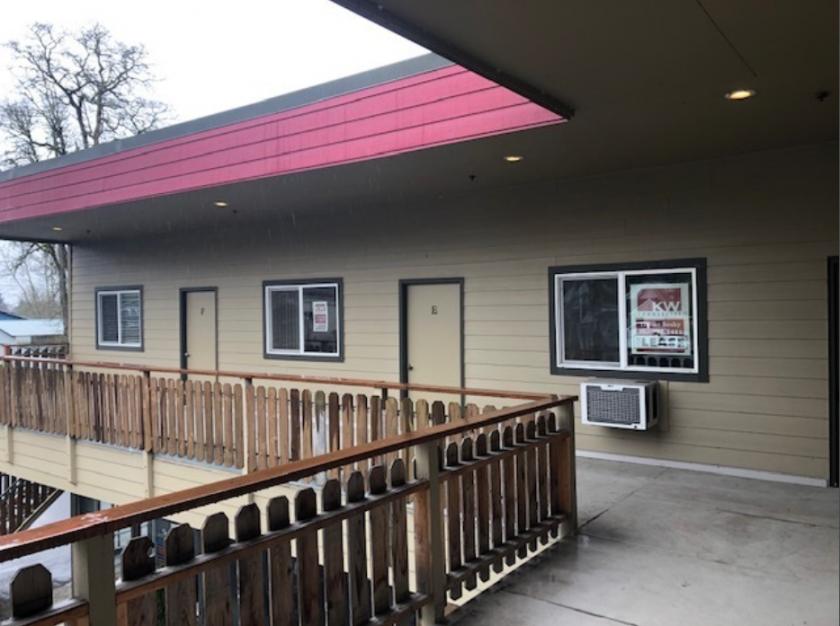
- • Abundant Parking and Outside Storage Available
- • Building Renovated in 2015
- • Building Signage Available
- • Diverse Tenant Mix
Listing Agents

Trevor Sosky
KW Commercial
O: 360-816-9651
M: 360-798-1413
trevor@kwcommercial.com
KW Commercial
O: 360-816-9651
M: 360-798-1413
trevor@kwcommercial.com
While we strive to provide the most accurate information, all listing information, and demographic data, is provided by third-parties. As such, MyEListing will not be responsible for the accuracy of the information. It is strongly recommended that you verify all information with the listing agent, and any relevant agencies, prior to making any decisions.