Commercial Land
Centerbrook Universal City, TX 78148
Centerbrook Universal City, TX 78148
Details & Description
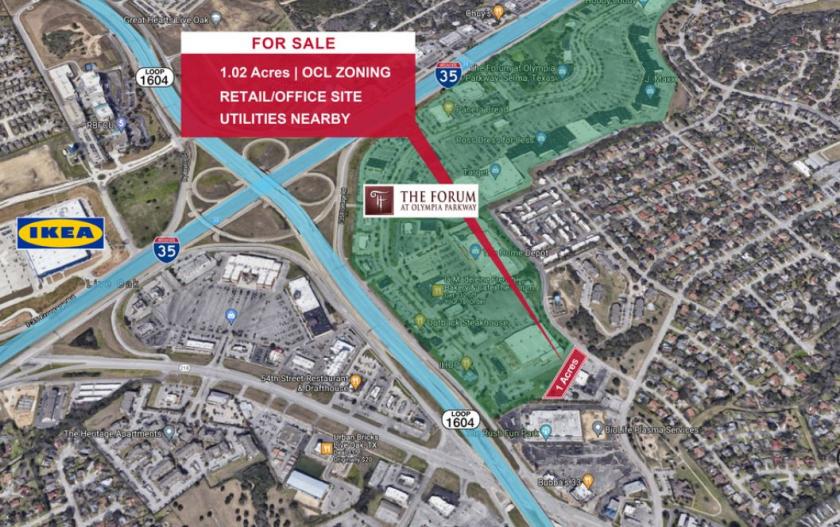
Property Highlights
• Quick access to IH-35 Loop 1604
• Motivated seller
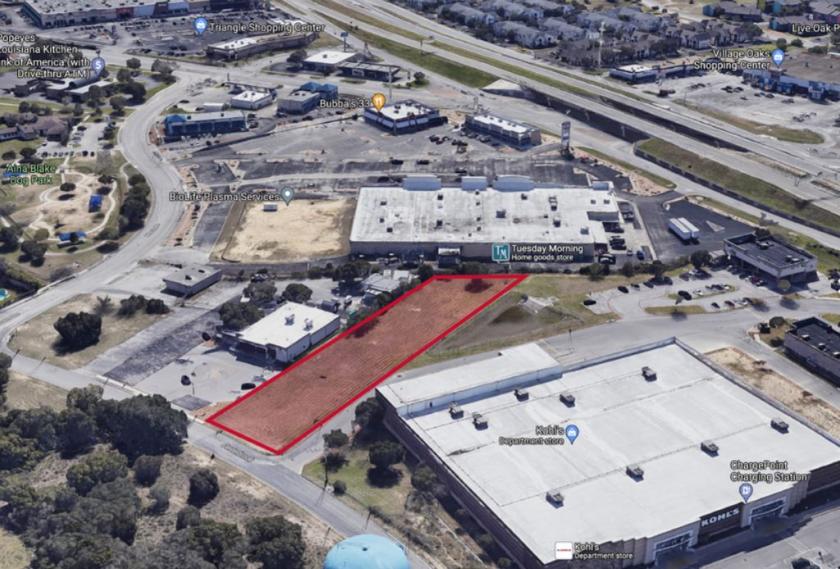
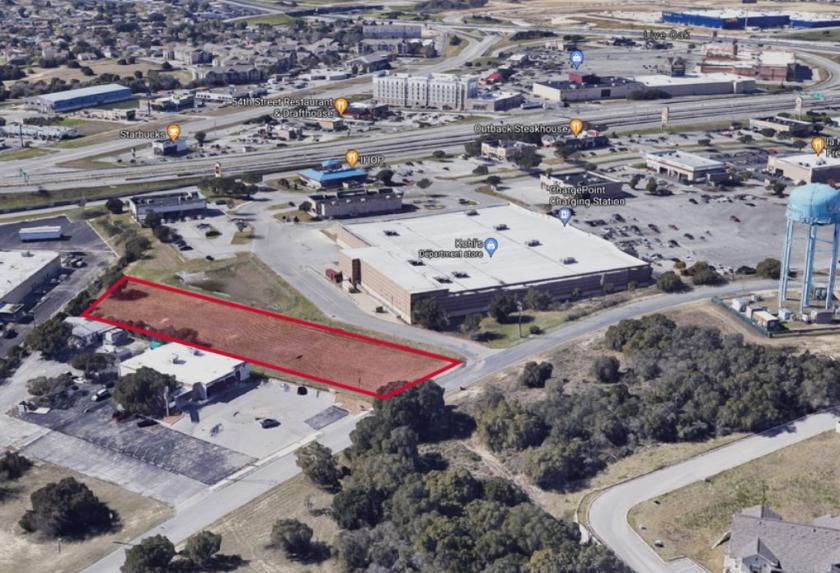
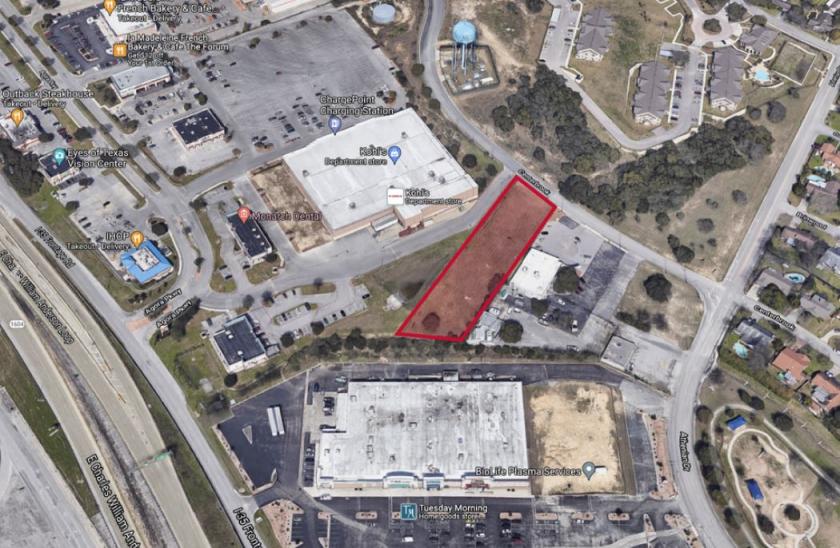
Additional Photos
Listing Agents

Rav Singh
O: 210-696-9996
M: 210-849-2175
rav@kwcommercial.com
O: 210-696-9996
M: 210-849-2175
rav@kwcommercial.com
While we strive to provide the most accurate information, all listing information, and demographic data, is provided by third-parties. As such, MyEListing will not be responsible for the accuracy of the information. It is strongly recommended that you verify all information with the listing agent, and any relevant agencies, prior to making any decisions.


