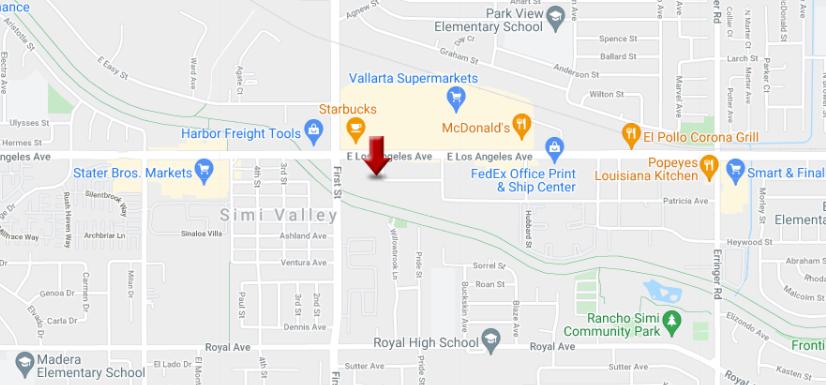
1-Mile | 3-Miles | 5-Miles | ||
---|---|---|---|---|
Total Population | 17,763 | 75,058 | 124,053 | |
Population Median Age | 36 | 39 | 40 | |
Population by Age | 0-9 Yrs | 2372 (13%) | 8072 (10%) | 13171 (10%) |
10-19 Yrs | 2269 (12%) | 10164 (13%) | 17399 (14%) | |
20-29 Yrs | 2804 (15%) | 10235 (13%) | 15807 (12%) | |
30-39 Yrs | 2404 (13%) | 9219 (12%) | 14256 (11%) | |
40-49 Yrs | 2533 (14%) | 10272 (13%) | 17280 (13%) | |
50-59 Yrs | 2692 (15%) | 11804 (15%) | 20087 (16%) | |
60-69 Yrs | 1281 (7%) | 8110 (10%) | 14239 (11%) | |
70+ Yrs | 1409 (7%) | 7181 (9%) | 11814 (9%) | |
Median HH Income | $81,930 | $99,025 | $104,472 | |
Total Household Income | < 24K | 710 (12%) | 2179 (8%) | 3487 (8%) |
25-49K | 981 (16%) | 3158 (12%) | 4993 (12%) | |
50-74K | 950 (16%) | 3412 (13%) | 5453 (13%) | |
75-99K | 1025 (17%) | 3750 (15%) | 5628 (13%) | |
100-199K | 1786 (30%) | 8669 (35%) | 14507 (35%) | |
200K+ | 399 (6%) | 3539 (14%) | 6779 (16%) | |
Highest Education Level | No Diploma | 1669 | 4615 | 6813 |
Diploma or GED | 2517 | 11452 | 17195 | |
Some College | 3179 | 13174 | 21066 | |
Assoc. Degree | 1542 | 5783 | 9188 | |
Bachelors Degree | 2104 | 11360 | 20370 | |
Higher Degree | 965 | 5472 | 11089 | |
Total Housing Units | 6,081 | 25,578 | 42,309 | |
--Owner-Occupied | 3,567 | 18,338 | 30,833 | |
--Renter-Occupied | 2,284 | 6,369 | 10,013 | |
Owner-Occupied Values | < 100K | 77 | 285 | 473 |
100-199K | 49 | 151 | 405 | |
200-299K | 250 | 583 | 807 | |
300-399K | 410 | 1303 | 2031 | |
400-499K | 1116 | 3796 | 5512 | |
500K+ | 1665 | 12220 | 21605 | |
Total Working Age Population | 13,844 | 60,770 | 100,326 | |
In Work Force | 9,703 | 41,330 | 67,676 | |
Not In Work Force | 4,141 | 19,440 | 32,650 | |
Workforce Employed | 9,206 | 39,429 | 64,437 | |
Workforce Unemployed | 497 | 1,895 | 3,230 | |
Civlian Workforce | 9,703 | 41,324 | 67,667 | |
Military Workforce | 0 | 6 | 10 | |
Total Households | 5,851 | 24,708 | 40,846 | |
Family Households | 4,013 | 18,262 | 30,531 | |
Non-Family Households | 1,837 | 6,446 | 10,315 | |
Married Couple | 2,710 | 13,884 | 24,033 | |
Other Family | 1,304 | 4,379 | 6,499 | |
Married w/Child | 1,286 | 5,761 | 10,049 | |
Single Male w/Child | 159 | 553 | 838 | |
Single Female w/Child | 500 | 1,217 | 1,709 |
Population Change Last Two Decades - Plus Projection
2000 | % | 2010 | % | 2020 | % | 2030 | |
---|---|---|---|---|---|---|---|
California | 33,871,648 | +10 | 37,253,956 | +9 | 40,467,295 | +8 | 43,631,295 |
Los Angeles County | 9,519,338 | +3 | 9,818,605 | +6 | 10,369,367 | +4 | 10,759,850 |
Ventura County | 753,197 | +9 | 823,318 | +5 | 863,528 | +5 | 909,779 |
Total Working Age Population:
Total Households:
Total Working Age Population:
Total Households:
Total Working Age Population:
Total Households: