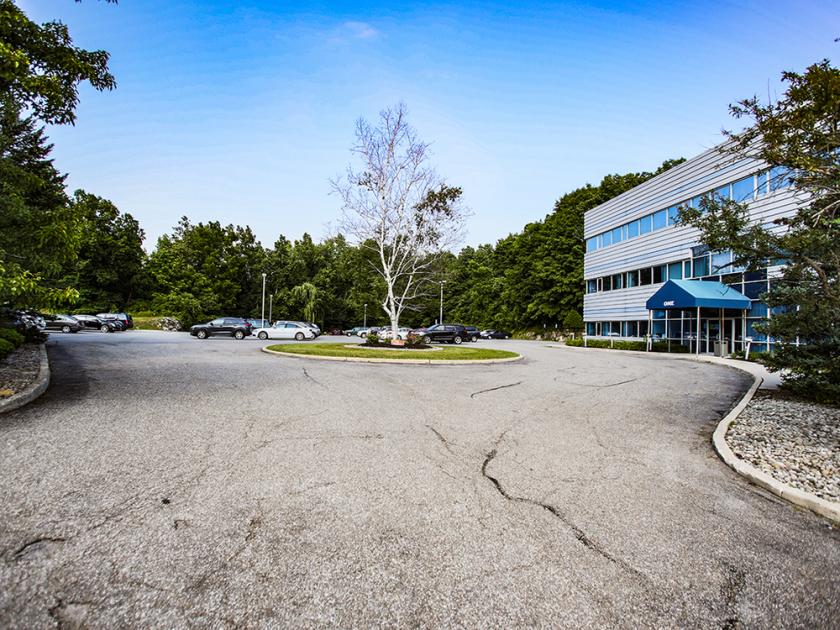
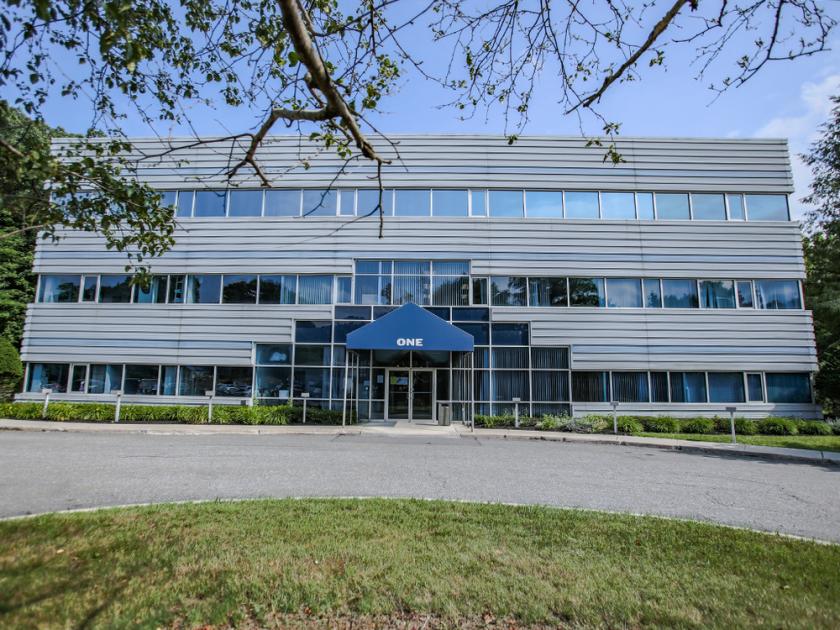
1-Mile | 3-Miles | 5-Miles | ||
---|---|---|---|---|
Total Population | 8,837 | 63,911 | 113,266 | |
Population Median Age | 36 | 37 | 39 | |
Population by Age | 0-9 Yrs | 1353 (15%) | 8615 (13%) | 14170 (12%) |
10-19 Yrs | 1547 (17%) | 9047 (14%) | 14563 (12%) | |
20-29 Yrs | 956 (10%) | 8969 (14%) | 15251 (13%) | |
30-39 Yrs | 1242 (14%) | 8887 (13%) | 15421 (13%) | |
40-49 Yrs | 1046 (11%) | 7562 (11%) | 14308 (12%) | |
50-59 Yrs | 1178 (13%) | 7983 (12%) | 15413 (13%) | |
60-69 Yrs | 657 (7%) | 6766 (10%) | 12921 (11%) | |
70+ Yrs | 857 (9%) | 6082 (9%) | 11219 (9%) | |
Median HH Income | $58,268 | $54,877 | $68,789 | |
Total Household Income | < 24K | 895 (28%) | 5605 (23%) | 7549 (17%) |
25-49K | 546 (17%) | 5708 (23%) | 8759 (20%) | |
50-74K | 498 (16%) | 3683 (15%) | 6307 (15%) | |
75-99K | 407 (13%) | 2885 (12%) | 5364 (12%) | |
100-199K | 694 (22%) | 5092 (21%) | 10827 (25%) | |
200K+ | 51 (1%) | 955 (3%) | 3180 (7%) | |
Highest Education Level | No Diploma | 904 | 6219 | 8630 |
Diploma or GED | 2335 | 13747 | 22635 | |
Some College | 893 | 7743 | 14844 | |
Assoc. Degree | 380 | 4038 | 7612 | |
Bachelors Degree | 768 | 5557 | 13041 | |
Higher Degree | 319 | 4138 | 10041 | |
Total Housing Units | 3,420 | 27,839 | 47,841 | |
--Owner-Occupied | 1,476 | 12,156 | 24,520 | |
--Renter-Occupied | 1,614 | 11,772 | 17,466 | |
Owner-Occupied Values | < 100K | 123 | 1399 | 2023 |
100-199K | 579 | 3806 | 5473 | |
200-299K | 516 | 4548 | 8643 | |
300-399K | 187 | 1603 | 4886 | |
400-499K | 47 | 420 | 2151 | |
500K+ | 24 | 381 | 1344 | |
Total Working Age Population | 6,542 | 50,179 | 90,683 | |
In Work Force | 4,119 | 32,537 | 58,999 | |
Not In Work Force | 2,423 | 17,642 | 31,685 | |
Workforce Employed | 3,901 | 30,432 | 55,404 | |
Workforce Unemployed | 213 | 1,909 | 3,033 | |
Civlian Workforce | 4,114 | 32,341 | 58,437 | |
Military Workforce | 5 | 196 | 562 | |
Total Households | 3,090 | 23,928 | 41,986 | |
Family Households | 2,026 | 14,464 | 26,755 | |
Non-Family Households | 1,064 | 9,464 | 15,232 | |
Married Couple | 1,363 | 8,744 | 18,333 | |
Other Family | 663 | 5,721 | 8,421 | |
Married w/Child | 725 | 3,676 | 7,351 | |
Single Male w/Child | 22 | 586 | 959 | |
Single Female w/Child | 275 | 2,811 | 3,788 |
Population Change Last Two Decades - Plus Projection
2000 | % | 2010 | % | 2020 | % | 2030 | |
---|---|---|---|---|---|---|---|
New York | 18,976,457 | +2 | 19,378,102 | +4 | 20,146,131 | +2 | 20,604,030 |
Dutchess County | 280,150 | +6 | 297,488 | -2 | 292,936 | -1 | 290,338 |
Orange County | 341,367 | +9 | 372,813 | +3 | 384,125 | +4 | 397,598 |
Putnam County | 95,745 | +4 | 99,710 | 0 | 99,274 | +1 | 100,199 |
Total Working Age Population:
Total Households:
Total Working Age Population:
Total Households:
Total Working Age Population:
Total Households: