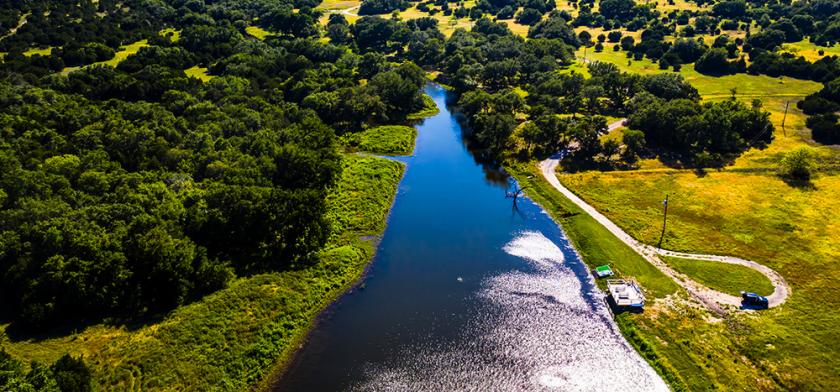
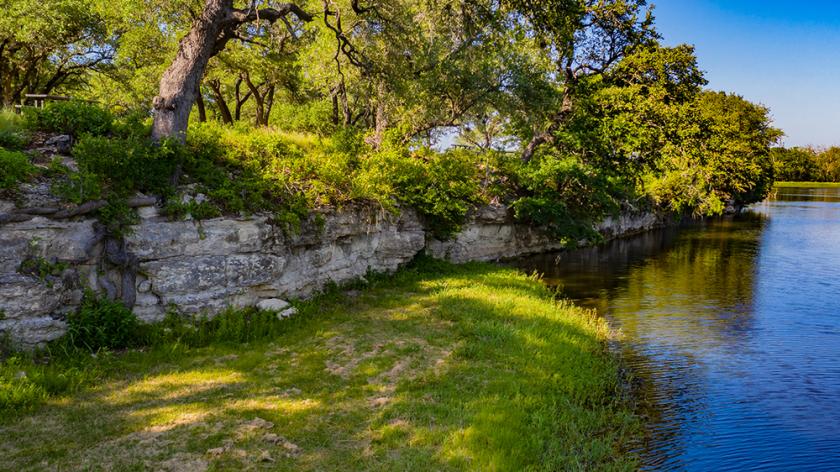
1-Mile | 3-Miles | 5-Miles | ||
---|---|---|---|---|
Total Population | 316 | 2,643 | 6,060 | |
Population Median Age | 37 | 37 | 37 | |
Population by Age | 0-9 Yrs | 36 (11%) | 330 (12%) | 773 (12%) |
10-19 Yrs | 44 (13%) | 398 (15%) | 941 (15%) | |
20-29 Yrs | 43 (13%) | 354 (13%) | 780 (12%) | |
30-39 Yrs | 46 (14%) | 355 (13%) | 785 (12%) | |
40-49 Yrs | 52 (16%) | 448 (16%) | 1000 (16%) | |
50-59 Yrs | 38 (12%) | 315 (11%) | 745 (12%) | |
60-69 Yrs | 29 (9%) | 225 (8%) | 540 (8%) | |
70+ Yrs | 27 (8%) | 217 (8%) | 495 (8%) | |
Median HH Income | $68,547 | $73,731 | $78,019 | |
Total Household Income | < 24K | 14 (12%) | 101 (11%) | 216 (10%) |
25-49K | 22 (20%) | 171 (19%) | 369 (18%) | |
50-74K | 24 (21%) | 181 (20%) | 383 (19%) | |
75-99K | 12 (10%) | 114 (12%) | 286 (14%) | |
100-199K | 35 (31%) | 285 (31%) | 619 (30%) | |
200K+ | 3 (2%) | 39 (4%) | 132 (6%) | |
Highest Education Level | No Diploma | 18 | 138 | 316 |
Diploma or GED | 70 | 549 | 1202 | |
Some College | 47 | 396 | 930 | |
Assoc. Degree | 21 | 177 | 412 | |
Bachelors Degree | 32 | 268 | 641 | |
Higher Degree | 18 | 148 | 330 | |
Total Housing Units | 118 | 952 | 2,159 | |
--Owner-Occupied | 82 | 679 | 1,585 | |
--Renter-Occupied | 29 | 213 | 420 | |
Owner-Occupied Values | < 100K | 7 | 57 | 152 |
100-199K | 28 | 233 | 505 | |
200-299K | 27 | 194 | 398 | |
300-399K | 10 | 80 | 181 | |
400-499K | 4 | 41 | 112 | |
500K+ | 6 | 75 | 237 | |
Total Working Age Population | 253 | 2,089 | 4,762 | |
In Work Force | 172 | 1,408 | 3,183 | |
Not In Work Force | 81 | 682 | 1,580 | |
Workforce Employed | 170 | 1,388 | 3,133 | |
Workforce Unemployed | 3 | 20 | 50 | |
Civlian Workforce | 172 | 1,408 | 3,183 | |
Military Workforce | 0 | 0 | 0 | |
Total Households | 110 | 892 | 2,004 | |
Family Households | 75 | 626 | 1,463 | |
Non-Family Households | 35 | 266 | 541 | |
Married Couple | 63 | 536 | 1,259 | |
Other Family | 12 | 90 | 204 | |
Married w/Child | 26 | 228 | 527 | |
Single Male w/Child | 2 | 13 | 34 | |
Single Female w/Child | 6 | 43 | 90 |
Population Change Last Two Decades - Plus Projection
2000 | % | 2010 | % | 2020 | % | 2030 | |
---|---|---|---|---|---|---|---|
Texas | 20,851,820 | +21 | 25,145,561 | +18 | 29,677,668 | +18 | 34,894,452 |
Burnet County | 34,147 | +25 | 42,750 | +13 | 48,196 | +11 | 53,458 |
Travis County | 812,280 | +26 | 1,024,266 | +26 | 1,291,502 | +19 | 1,540,812 |
Williamson County | 249,967 | +69 | 422,679 | +40 | 589,914 | +41 | 830,421 |
Total Working Age Population:
Total Households:
Total Working Age Population:
Total Households:
Total Working Age Population:
Total Households: