Commercial Land
11440 California Street Loma Linda, CA 92354
11440 California Street Loma Linda, CA 92354
Details & Description
Property Highlights
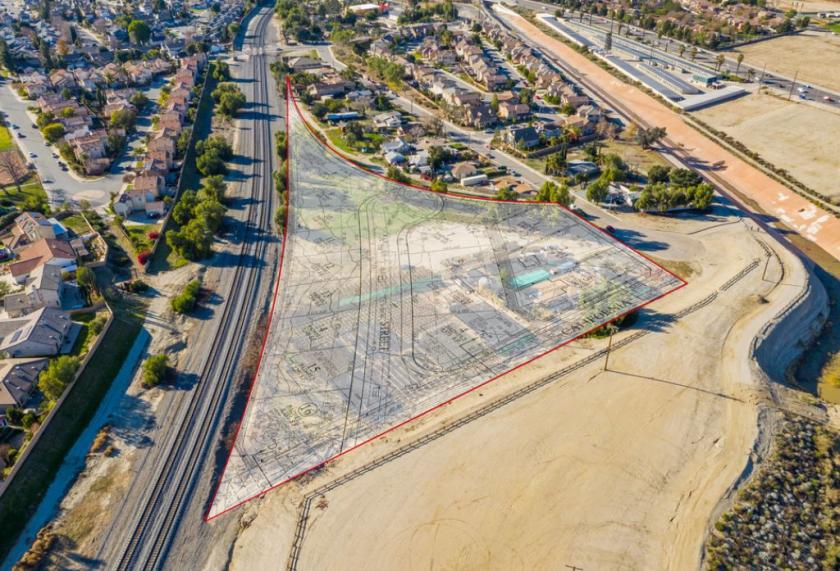
- • APPROVED TTM FOR 16 LOTS
- • SOUTH OF BARTON RD
- • PROMIXITY TO LOMA LINDA HOSPITAL
- • NEARBY NEW CONSTRUCTION SELLING IN THE HIGH $500K
Additional Photos

Listing Agents

T.C. Obichang
KW Commercial
O: 951-703-0377
tc.obi@kw.com
KW Commercial
O: 951-703-0377
tc.obi@kw.com
While we strive to provide the most accurate information, all listing information, and demographic data, is provided by third-parties. As such, MyEListing will not be responsible for the accuracy of the information. It is strongly recommended that you verify all information with the listing agent, and any relevant agencies, prior to making any decisions.


