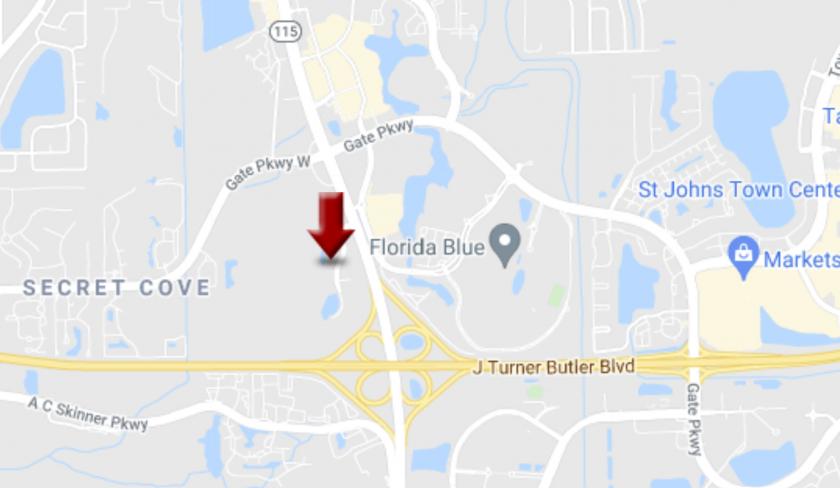
1-Mile | 3-Miles | 5-Miles | ||
---|---|---|---|---|
Total Population | 9,135 | 65,082 | 191,089 | |
Population Median Age | 36 | 37 | 37 | |
Population by Age | 0-9 Yrs | 828 (9%) | 6415 (9%) | 21702 (11%) |
10-19 Yrs | 702 (7%) | 6411 (9%) | 21985 (11%) | |
20-29 Yrs | 2206 (24%) | 14253 (21%) | 35670 (18%) | |
30-39 Yrs | 2103 (23%) | 12215 (18%) | 29905 (15%) | |
40-49 Yrs | 1182 (12%) | 7569 (11%) | 22788 (11%) | |
50-59 Yrs | 831 (9%) | 7299 (11%) | 23958 (12%) | |
60-69 Yrs | 670 (7%) | 5716 (8%) | 18502 (9%) | |
70+ Yrs | 613 (6%) | 5205 (7%) | 16579 (8%) | |
Median HH Income | $66,584 | $58,357 | $56,305 | |
Total Household Income | < 24K | 577 (12%) | 5075 (17%) | 14908 (19%) |
25-49K | 906 (20%) | 6459 (22%) | 19474 (24%) | |
50-74K | 959 (21%) | 6217 (21%) | 15266 (19%) | |
75-99K | 807 (17%) | 4775 (16%) | 10939 (14%) | |
100-199K | 1008 (22%) | 4758 (16%) | 13317 (17%) | |
200K+ | 264 (5%) | 1362 (4%) | 4093 (5%) | |
Highest Education Level | No Diploma | 157 | 3401 | 12349 |
Diploma or GED | 928 | 9305 | 31714 | |
Some College | 1068 | 9760 | 26847 | |
Assoc. Degree | 677 | 4702 | 13130 | |
Bachelors Degree | 2493 | 12841 | 31916 | |
Higher Degree | 1319 | 6242 | 15836 | |
Total Housing Units | 5,310 | 32,601 | 87,819 | |
--Owner-Occupied | 1,385 | 10,025 | 34,932 | |
--Renter-Occupied | 3,137 | 18,621 | 43,063 | |
Owner-Occupied Values | < 100K | 112 | 1821 | 5552 |
100-199K | 563 | 4631 | 14256 | |
200-299K | 356 | 1838 | 8014 | |
300-399K | 289 | 867 | 3395 | |
400-499K | 29 | 422 | 1565 | |
500K+ | 35 | 446 | 2150 | |
Total Working Age Population | 7,857 | 55,383 | 156,903 | |
In Work Force | 5,874 | 39,021 | 107,555 | |
Not In Work Force | 1,983 | 16,362 | 49,348 | |
Workforce Employed | 5,609 | 36,906 | 101,067 | |
Workforce Unemployed | 154 | 1,478 | 5,074 | |
Civlian Workforce | 5,763 | 38,384 | 106,141 | |
Military Workforce | 111 | 637 | 1,414 | |
Total Households | 4,522 | 28,646 | 77,996 | |
Family Households | 1,983 | 13,984 | 43,024 | |
Non-Family Households | 2,539 | 14,662 | 34,972 | |
Married Couple | 1,580 | 10,004 | 29,893 | |
Other Family | 403 | 3,980 | 13,130 | |
Married w/Child | 644 | 3,542 | 11,706 | |
Single Male w/Child | 39 | 420 | 1,493 | |
Single Female w/Child | 131 | 1,425 | 4,697 |
Population Change Last Two Decades - Plus Projection
2000 | % | 2010 | % | 2020 | % | 2030 | |
---|---|---|---|---|---|---|---|
Florida | 15,982,378 | +18 | 18,801,310 | +14 | 21,517,610 | +13 | 24,340,457 |
Clay County | 140,814 | +36 | 190,865 | +15 | 220,221 | +16 | 255,695 |
Duval County | 778,879 | +11 | 864,263 | +14 | 981,852 | +12 | 1,095,165 |
Nassau County | 57,663 | +27 | 73,314 | +18 | 86,416 | +18 | 102,124 |
St. Johns County | 123,135 | +54 | 190,039 | +35 | 256,127 | +29 | 329,487 |
Total Working Age Population:
Total Households:
Total Working Age Population:
Total Households:
Total Working Age Population:
Total Households: