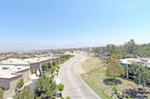
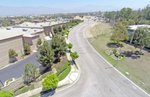
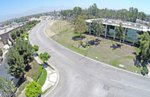
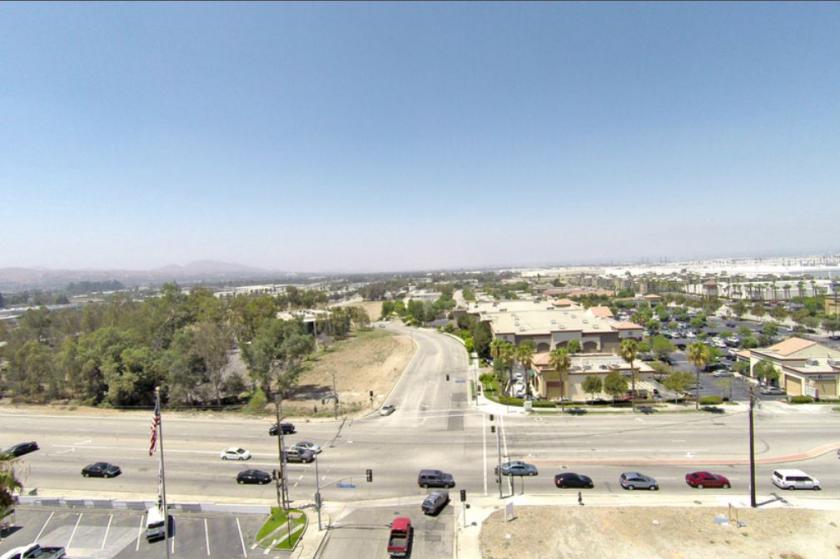
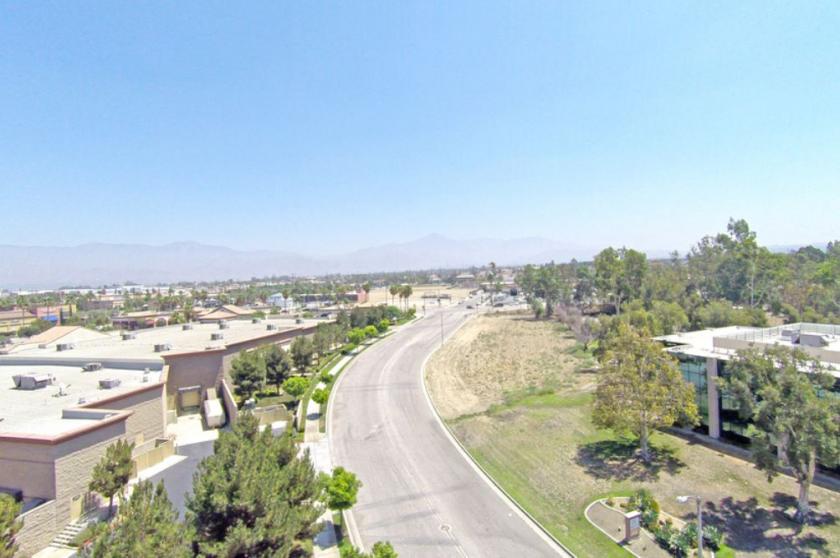
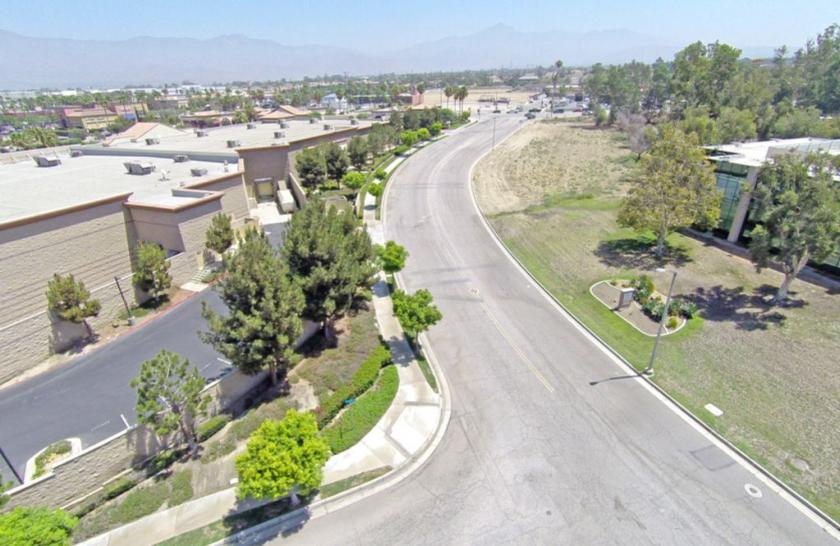
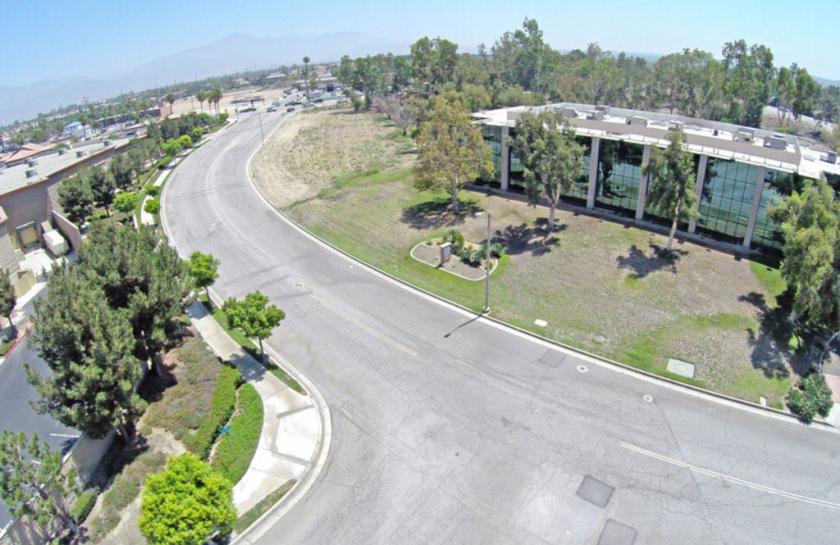
1-Mile | 3-Miles | 5-Miles | ||
---|---|---|---|---|
Total Population | 3,473 | 73,541 | 200,881 | |
Population Median Age | 35 | 38 | 36 | |
Population by Age | 0-9 Yrs | 559 (16%) | 9590 (13%) | 28899 (14%) |
10-19 Yrs | 265 (7%) | 8945 (12%) | 27388 (13%) | |
20-29 Yrs | 630 (18%) | 11936 (16%) | 33193 (16%) | |
30-39 Yrs | 815 (23%) | 11282 (15%) | 28421 (14%) | |
40-49 Yrs | 274 (7%) | 8168 (11%) | 23664 (11%) | |
50-59 Yrs | 358 (10%) | 7876 (10%) | 23183 (11%) | |
60-69 Yrs | 340 (9%) | 8298 (11%) | 19754 (9%) | |
70+ Yrs | 232 (6%) | 7445 (10%) | 16380 (8%) | |
Median HH Income | $59,430 | $62,274 | $60,725 | |
Total Household Income | < 24K | 288 (22%) | 4880 (19%) | 12647 (20%) |
25-49K | 209 (16%) | 5099 (20%) | 12920 (20%) | |
50-74K | 240 (18%) | 4402 (17%) | 11107 (17%) | |
75-99K | 185 (14%) | 3504 (13%) | 8043 (12%) | |
100-199K | 297 (23%) | 5517 (21%) | 13741 (21%) | |
200K+ | 61 (4%) | 1680 (6%) | 4460 (7%) | |
Highest Education Level | No Diploma | 373 | 6996 | 23844 |
Diploma or GED | 579 | 10282 | 28532 | |
Some College | 482 | 10328 | 27539 | |
Assoc. Degree | 110 | 4004 | 10566 | |
Bachelors Degree | 570 | 10594 | 21984 | |
Higher Degree | 345 | 7714 | 16794 | |
Total Housing Units | 1,446 | 27,688 | 67,623 | |
--Owner-Occupied | 380 | 11,960 | 33,941 | |
--Renter-Occupied | 901 | 13,123 | 28,977 | |
Owner-Occupied Values | < 100K | 35 | 693 | 2870 |
100-199K | 30 | 859 | 2862 | |
200-299K | 163 | 2905 | 7554 | |
300-399K | 100 | 3550 | 9212 | |
400-499K | 42 | 2359 | 6017 | |
500K+ | 11 | 1593 | 5427 | |
Total Working Age Population | 2,728 | 58,986 | 156,211 | |
In Work Force | 1,764 | 35,314 | 92,887 | |
Not In Work Force | 964 | 23,672 | 63,324 | |
Workforce Employed | 1,660 | 33,406 | 86,122 | |
Workforce Unemployed | 104 | 1,896 | 6,684 | |
Civlian Workforce | 1,764 | 35,303 | 92,806 | |
Military Workforce | 0 | 12 | 81 | |
Total Households | 1,281 | 25,083 | 62,918 | |
Family Households | 776 | 16,976 | 45,524 | |
Non-Family Households | 505 | 8,107 | 17,394 | |
Married Couple | 421 | 11,476 | 30,403 | |
Other Family | 355 | 5,500 | 15,120 | |
Married w/Child | 200 | 4,568 | 13,214 | |
Single Male w/Child | 29 | 445 | 1,729 | |
Single Female w/Child | 108 | 1,829 | 5,777 |
Population Change Last Two Decades - Plus Projection
2000 | % | 2010 | % | 2020 | % | 2030 | |
---|---|---|---|---|---|---|---|
California | 33,871,648 | +10 | 37,253,956 | +9 | 40,467,295 | +8 | 43,631,295 |
Riverside County | 1,545,387 | +42 | 2,189,641 | +14 | 2,493,116 | +14 | 2,843,493 |
San Bernardino County | 1,709,434 | +19 | 2,035,210 | +9 | 2,223,189 | +11 | 2,468,202 |
Total Working Age Population:
Total Households:
Total Working Age Population:
Total Households:
Total Working Age Population:
Total Households: