Health Care and Medical Properties
4745 Calle De Vida San Diego, CA 92124
4745 Calle De Vida San Diego, CA 92124
Details & Description
Property Highlights
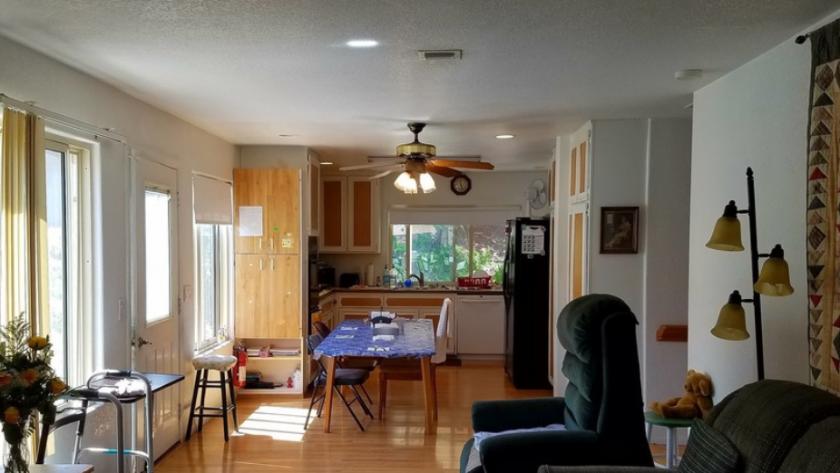
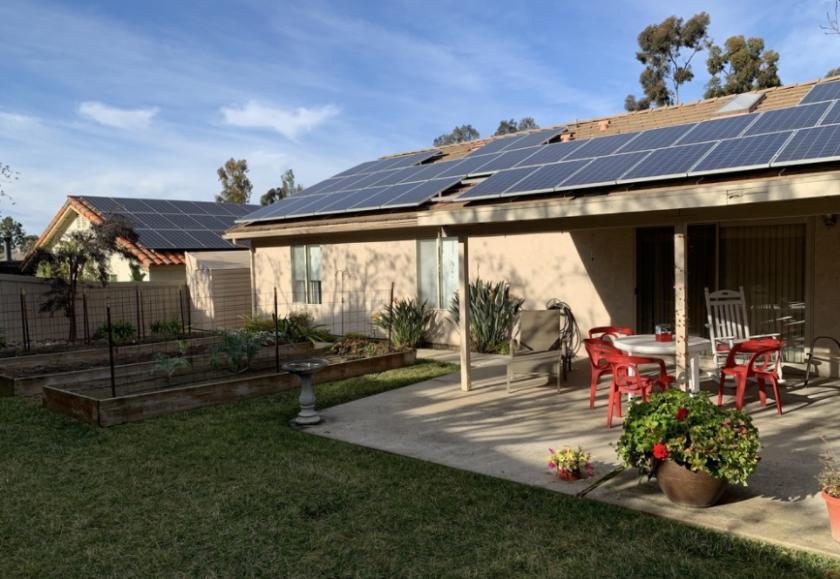
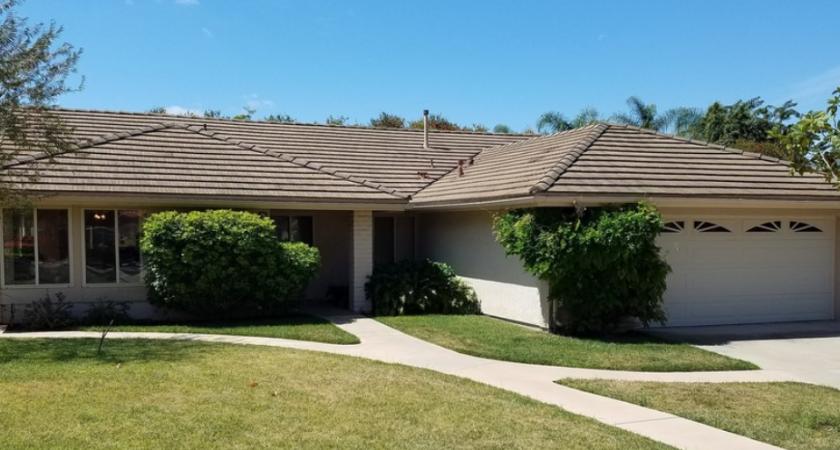
- • Accommodates Non-Ambulatory Residents
- • Facility Licensed for 6 beds - with 7 Bathrooms
- • 2 Hospice Waivers in Place
Listing Agents

Christopher Parrino
KW Commercial
O: 619-308-6860
cparrino@kwcommercial.com
KW Commercial
O: 619-308-6860
cparrino@kwcommercial.com

Toni Donnet
O: 619-469-0700
M: 619-549-8072
toni.donnet@gmail.com
O: 619-469-0700
M: 619-549-8072
toni.donnet@gmail.com
While we strive to provide the most accurate information, all listing information, and demographic data, is provided by third-parties. As such, MyEListing will not be responsible for the accuracy of the information. It is strongly recommended that you verify all information with the listing agent, and any relevant agencies, prior to making any decisions.