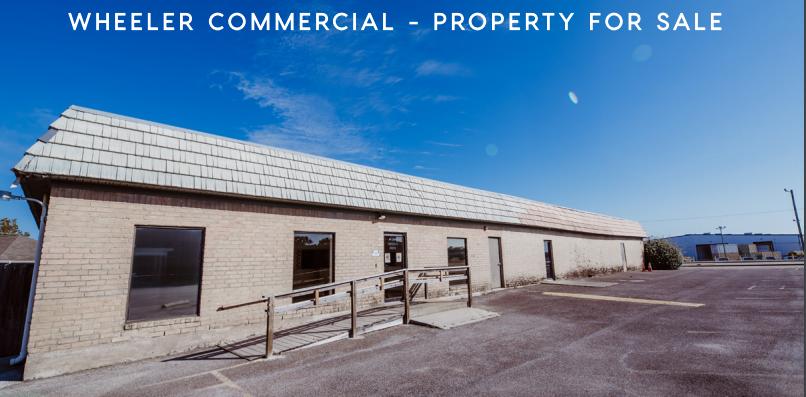
Office Space
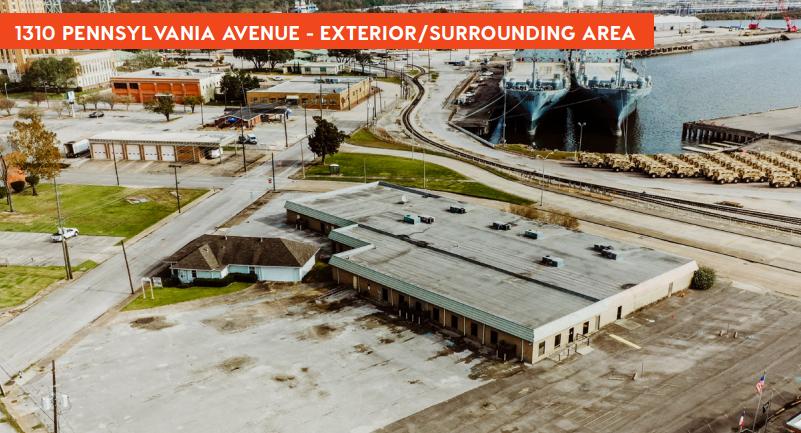
1310 Pennsylvania Avenue Beaumont, TX 77701
1310 Pennsylvania Avenue Beaumont, TX 77701
Details & Description
Property Highlights
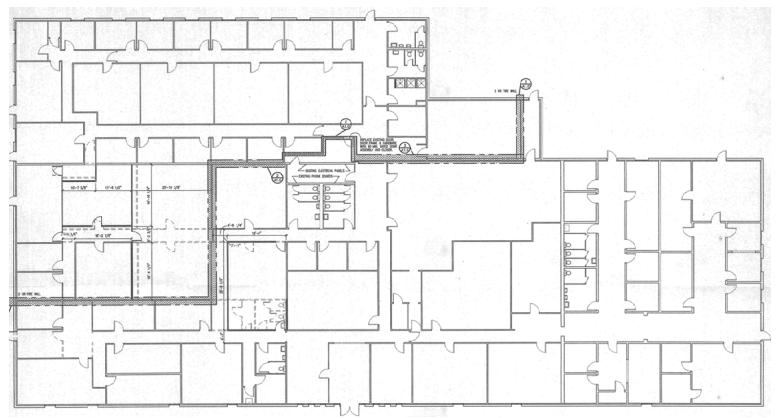
- • 26,587 SF available for lease or sale
- • Space can be divided for lease
- • Single story office building
- • Fire Sprinkler System
- • Engineered positive drain roof
- • 1.83 Acres located in downtown Beaumont
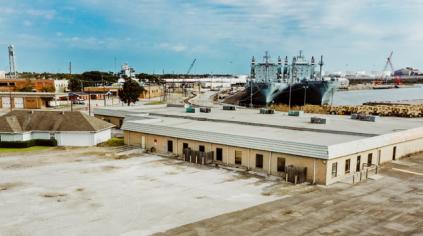
Additional Photos

Listing Agents

Lee Wheeler
O: 409-899-3300
lwheeler@wheelercommercial.com
O: 409-899-3300
lwheeler@wheelercommercial.com
While we strive to provide the most accurate information, all listing information, and demographic data, is provided by third-parties. As such, MyEListing will not be responsible for the accuracy of the information. It is strongly recommended that you verify all information with the listing agent, and any relevant agencies, prior to making any decisions.


