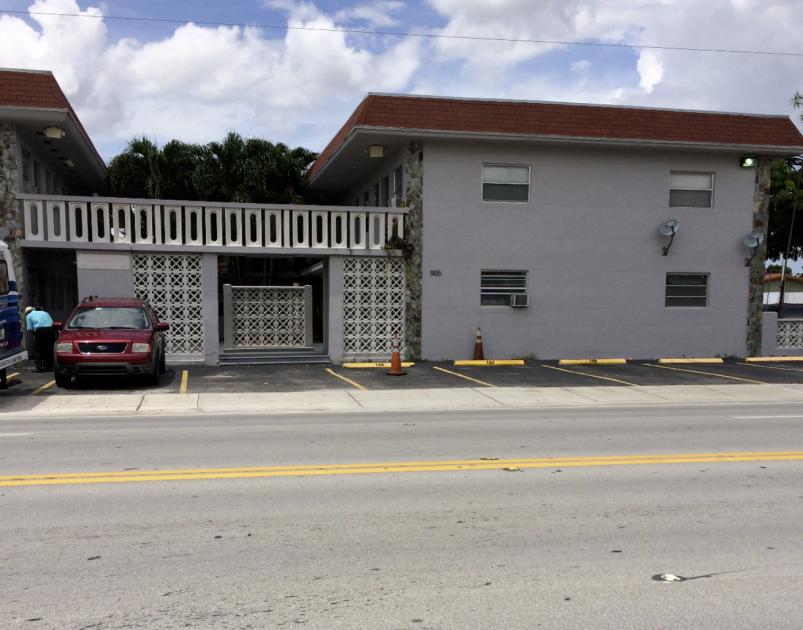
1-Mile | 3-Miles | 5-Miles | ||
---|---|---|---|---|
Total Population | 34,799 | 226,337 | 453,703 | |
Population Median Age | 44 | 43 | 41 | |
Population by Age | 0-9 Yrs | 3049 (8%) | 20220 (8%) | 47547 (10%) |
10-19 Yrs | 3599 (10%) | 23286 (10%) | 52615 (11%) | |
20-29 Yrs | 4188 (12%) | 27254 (12%) | 56562 (12%) | |
30-39 Yrs | 4148 (11%) | 27813 (12%) | 57309 (12%) | |
40-49 Yrs | 4688 (13%) | 32159 (14%) | 65882 (14%) | |
50-59 Yrs | 5374 (15%) | 35433 (15%) | 67040 (14%) | |
60-69 Yrs | 4077 (11%) | 25192 (11%) | 48597 (10%) | |
70+ Yrs | 5676 (16%) | 34981 (15%) | 58151 (12%) | |
Median HH Income | $31,268 | $34,671 | $39,397 | |
Total Household Income | < 24K | 4512 (40%) | 27370 (37%) | 47958 (33%) |
25-49K | 2875 (26%) | 18918 (25%) | 37165 (25%) | |
50-74K | 1778 (16%) | 11788 (16%) | 23794 (16%) | |
75-99K | 801 (7%) | 6699 (9%) | 13939 (9%) | |
100-199K | 870 (7%) | 7144 (9%) | 17514 (12%) | |
200K+ | 178 (1%) | 1263 (1%) | 3459 (2%) | |
Highest Education Level | No Diploma | 9556 | 51492 | 85446 |
Diploma or GED | 7893 | 55114 | 103344 | |
Some College | 3581 | 21222 | 41652 | |
Assoc. Degree | 2273 | 13638 | 29339 | |
Bachelors Degree | 2348 | 20306 | 45547 | |
Higher Degree | 741 | 8203 | 21867 | |
Total Housing Units | 11,442 | 77,288 | 155,223 | |
--Owner-Occupied | 4,052 | 32,281 | 66,367 | |
--Renter-Occupied | 6,962 | 40,902 | 77,462 | |
Owner-Occupied Values | < 100K | 555 | 3113 | 6980 |
100-199K | 722 | 9875 | 19420 | |
200-299K | 1633 | 9877 | 19286 | |
300-399K | 750 | 5820 | 11827 | |
400-499K | 206 | 1976 | 4477 | |
500K+ | 187 | 1619 | 4378 | |
Total Working Age Population | 29,621 | 192,355 | 374,806 | |
In Work Force | 15,487 | 110,086 | 222,486 | |
Not In Work Force | 14,134 | 82,269 | 152,321 | |
Workforce Employed | 14,798 | 105,068 | 211,187 | |
Workforce Unemployed | 690 | 4,998 | 11,172 | |
Civlian Workforce | 15,487 | 110,066 | 222,359 | |
Military Workforce | 0 | 20 | 127 | |
Total Households | 11,014 | 73,183 | 143,830 | |
Family Households | 7,992 | 51,959 | 103,439 | |
Non-Family Households | 3,022 | 21,223 | 40,391 | |
Married Couple | 4,664 | 31,453 | 61,945 | |
Other Family | 3,328 | 20,507 | 41,494 | |
Married w/Child | 1,523 | 11,031 | 23,548 | |
Single Male w/Child | 238 | 1,939 | 3,970 | |
Single Female w/Child | 1,126 | 6,123 | 13,200 |
Population Change Last Two Decades - Plus Projection
2000 | % | 2010 | % | 2020 | % | 2030 | |
---|---|---|---|---|---|---|---|
Florida | 15,982,378 | +18 | 18,801,310 | +14 | 21,517,610 | +13 | 24,340,457 |
Miami-Dade County | 2,253,362 | +11 | 2,496,435 | +15 | 2,861,579 | +11 | 3,190,242 |
Monroe County | 79,589 | -8 | 73,090 | +1 | 74,004 | 0 | 74,301 |
Total Working Age Population:
Total Households:
Total Working Age Population:
Total Households:
Total Working Age Population:
Total Households: