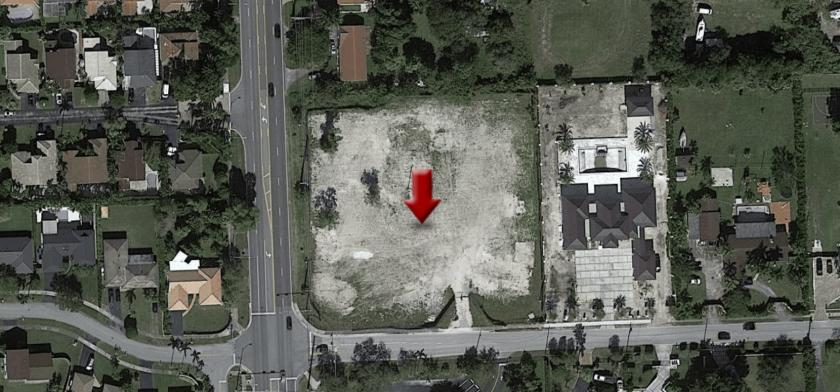
1-Mile | 3-Miles | 5-Miles | ||
---|---|---|---|---|
Total Population | 16,490 | 162,212 | 464,162 | |
Population Median Age | 45 | 41 | 41 | |
Population by Age | 0-9 Yrs | 1289 (7%) | 16365 (10%) | 45580 (9%) |
10-19 Yrs | 1268 (7%) | 17191 (10%) | 52980 (11%) | |
20-29 Yrs | 2274 (13%) | 21042 (12%) | 63138 (13%) | |
30-39 Yrs | 2315 (14%) | 21480 (13%) | 58606 (12%) | |
40-49 Yrs | 1785 (10%) | 23431 (14%) | 67167 (14%) | |
50-59 Yrs | 2537 (15%) | 24795 (15%) | 70228 (15%) | |
60-69 Yrs | 2207 (13%) | 18208 (11%) | 50633 (10%) | |
70+ Yrs | 2816 (17%) | 19698 (12%) | 55829 (12%) | |
Median HH Income | $65,632 | $67,264 | $66,105 | |
Total Household Income | < 24K | 1411 (23%) | 9351 (17%) | 25662 (17%) |
25-49K | 1003 (16%) | 9903 (18%) | 28622 (19%) | |
50-74K | 1018 (16%) | 9820 (18%) | 26194 (18%) | |
75-99K | 875 (14%) | 7071 (13%) | 19435 (13%) | |
100-199K | 1300 (21%) | 12479 (23%) | 32723 (22%) | |
200K+ | 463 (7%) | 4080 (7%) | 11018 (7%) | |
Highest Education Level | No Diploma | 1003 | 12766 | 43081 |
Diploma or GED | 2363 | 27654 | 84208 | |
Some College | 2554 | 22302 | 56242 | |
Assoc. Degree | 1526 | 13605 | 35361 | |
Bachelors Degree | 3322 | 26730 | 75035 | |
Higher Degree | 2304 | 15494 | 40229 | |
Total Housing Units | 6,765 | 56,054 | 152,925 | |
--Owner-Occupied | 3,818 | 34,349 | 95,037 | |
--Renter-Occupied | 2,253 | 18,354 | 48,617 | |
Owner-Occupied Values | < 100K | 101 | 857 | 2747 |
100-199K | 694 | 5802 | 15583 | |
200-299K | 1227 | 9664 | 25480 | |
300-399K | 643 | 8015 | 24122 | |
400-499K | 487 | 4579 | 12308 | |
500K+ | 666 | 5433 | 14797 | |
Total Working Age Population | 14,455 | 135,807 | 388,140 | |
In Work Force | 8,737 | 87,579 | 246,423 | |
Not In Work Force | 5,718 | 48,228 | 141,718 | |
Workforce Employed | 8,507 | 84,450 | 236,603 | |
Workforce Unemployed | 230 | 3,109 | 9,654 | |
Civlian Workforce | 8,737 | 87,559 | 246,258 | |
Military Workforce | 0 | 20 | 165 | |
Total Households | 6,071 | 52,703 | 143,655 | |
Family Households | 3,981 | 39,412 | 110,448 | |
Non-Family Households | 2,089 | 13,290 | 33,206 | |
Married Couple | 2,683 | 27,826 | 76,559 | |
Other Family | 1,299 | 11,586 | 33,889 | |
Married w/Child | 953 | 10,680 | 29,778 | |
Single Male w/Child | 93 | 895 | 2,746 | |
Single Female w/Child | 162 | 3,196 | 9,427 |
Population Change Last Two Decades - Plus Projection
2000 | % | 2010 | % | 2020 | % | 2030 | |
---|---|---|---|---|---|---|---|
Florida | 15,982,378 | +18 | 18,801,310 | +14 | 21,517,610 | +13 | 24,340,457 |
Miami-Dade County | 2,253,362 | +11 | 2,496,435 | +15 | 2,861,579 | +11 | 3,190,242 |
Monroe County | 79,589 | -8 | 73,090 | +1 | 74,004 | 0 | 74,301 |
Total Working Age Population:
Total Households:
Total Working Age Population:
Total Households:
Total Working Age Population:
Total Households: