Industrial Properties
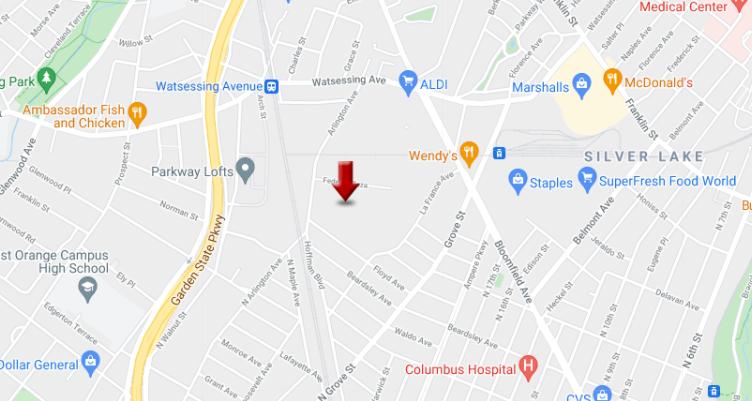
120 Arlington Avenue, 2 Bloomfield, NJ 07003
120 Arlington Avenue, 2 Bloomfield, NJ 07003
Details & Description
Property Highlights
- • FlexOfficeWarehouseStorage
- • Plenty of Parking
- • Great Location
- • 18 ft Ceiling Height
- • 1 Loading Dock, 1 Grade Level
Listing Agents

Gina Palumbo
KW Commercial
O: 201-391-2500
M: 201-820-5050
ginapalumbo@kw.com
KW Commercial
O: 201-391-2500
M: 201-820-5050
ginapalumbo@kw.com
While we strive to provide the most accurate information, all listing information, and demographic data, is provided by third-parties. As such, MyEListing will not be responsible for the accuracy of the information. It is strongly recommended that you verify all information with the listing agent, and any relevant agencies, prior to making any decisions.


