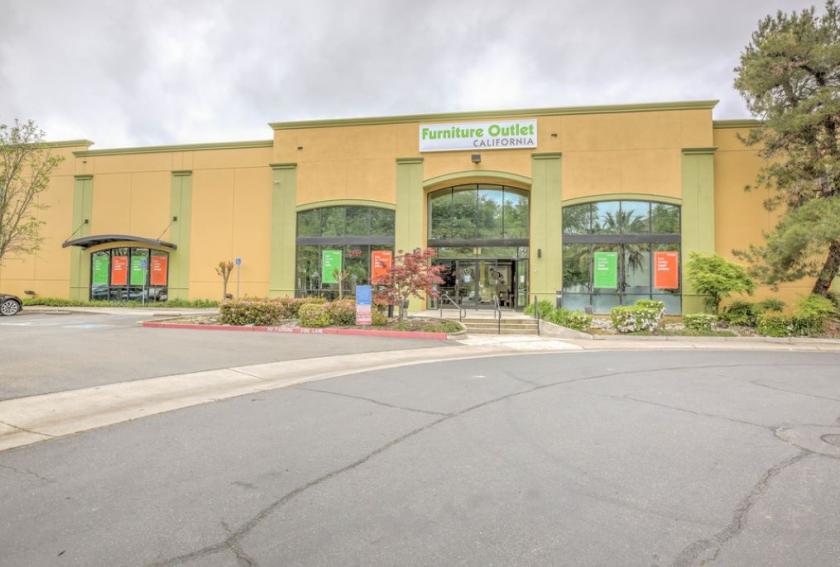
Retail Space
12171 Tributary Point Drive Gold River, CA 95670
12171 Tributary Point Drive Gold River, CA 95670
Details & Description
Property Highlights
- • Rare OwnerUser or Value-Add Investment Opportunity
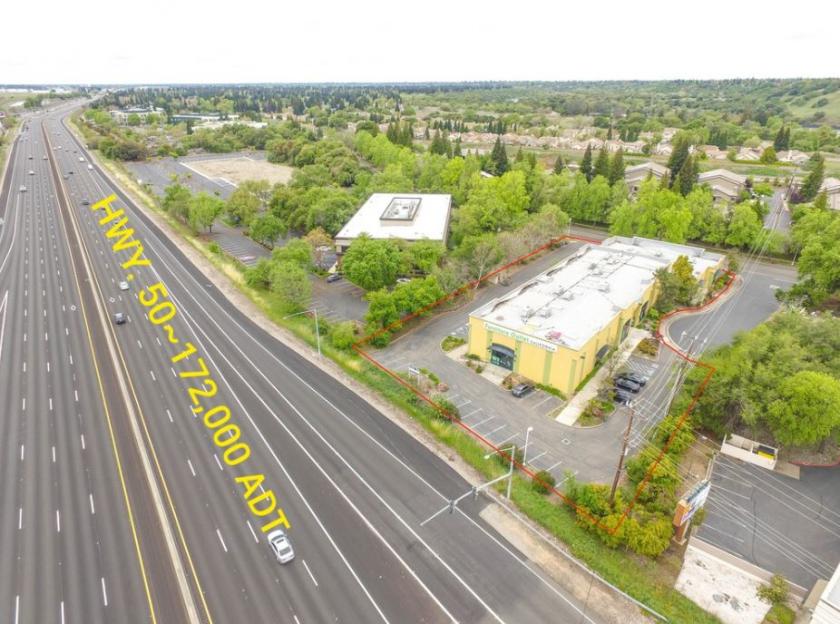
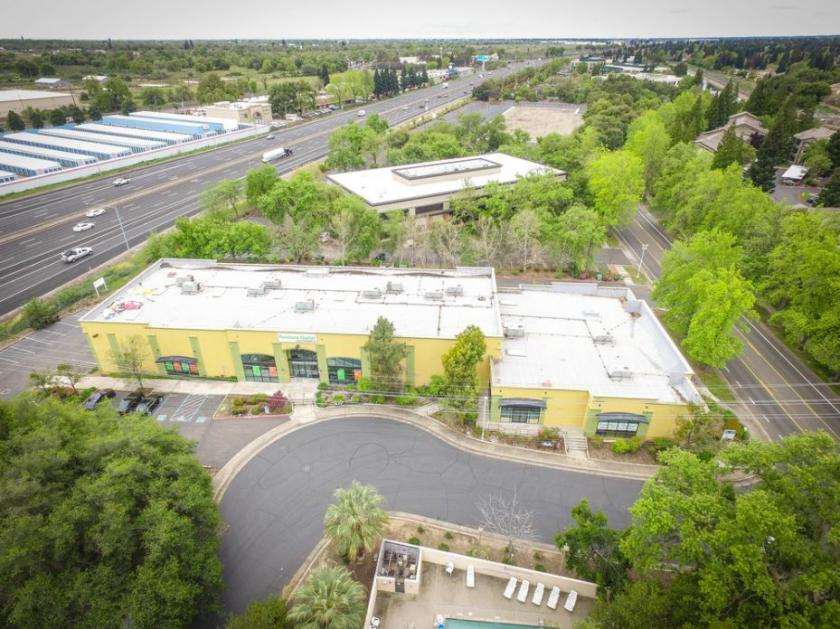
- • Tremendous Building Signage and Highway Visibility
- • Nearby Sacramento Aquatic Center
- • Great Ingress and Egress to Highway 50
- • Water Golden State Water Company
- • Electricity SMUD
Additional Photos

Listing Agents

Tuan Nguyen
KW Commercial
O: 916-798-5798
tuan@kwcommercial.com
KW Commercial
O: 916-798-5798
tuan@kwcommercial.com
While we strive to provide the most accurate information, all listing information, and demographic data, is provided by third-parties. As such, MyEListing will not be responsible for the accuracy of the information. It is strongly recommended that you verify all information with the listing agent, and any relevant agencies, prior to making any decisions.


