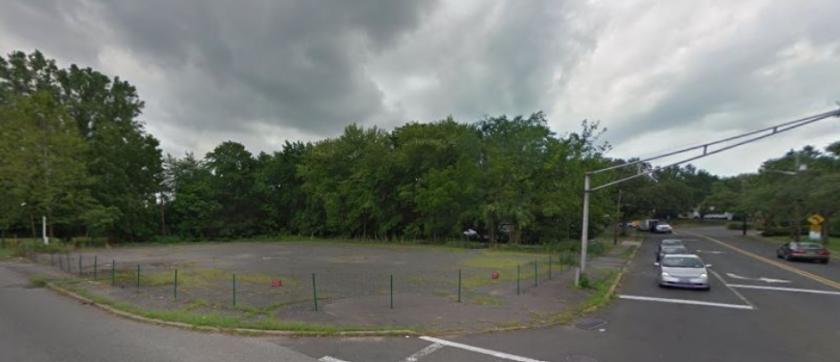
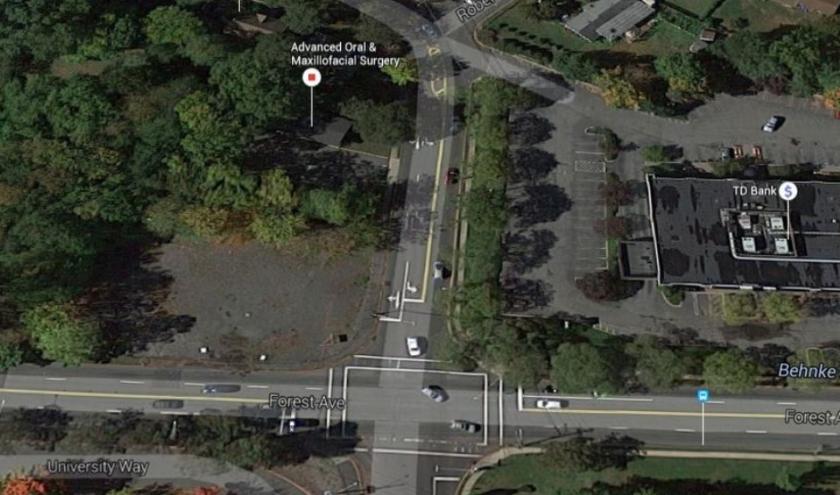
Commercial Land
269 Forest Avenue Paramus, NJ 07652
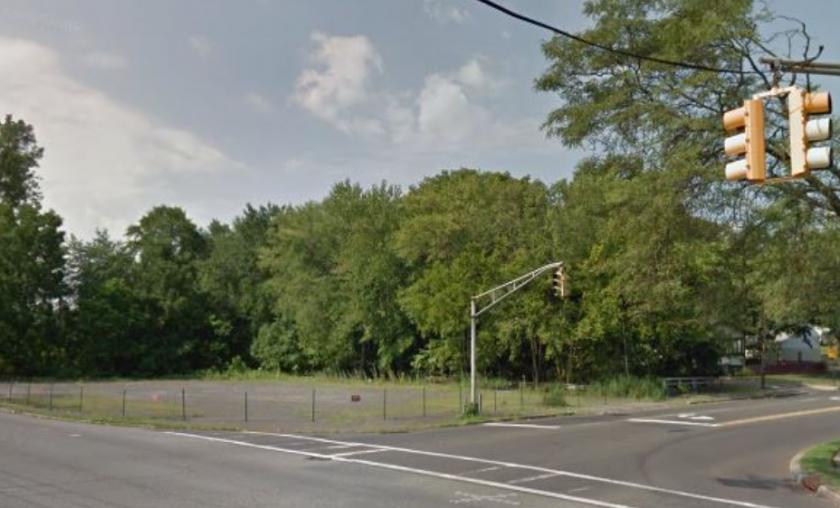
269 Forest Avenue Paramus, NJ 07652
Details & Description
Property Highlights
- • Prime Acre Lot
- • Heart of Paramus
- • Approved for a bank with drive-thru
- • Traffic Light Corner
- • Other possibilities
Listing Agents

Gina Palumbo
KW Commercial
O: 201-391-2500
M: 201-820-5050
ginapalumbo@kw.com
KW Commercial
O: 201-391-2500
M: 201-820-5050
ginapalumbo@kw.com
While we strive to provide the most accurate information, all listing information, and demographic data, is provided by third-parties. As such, MyEListing will not be responsible for the accuracy of the information. It is strongly recommended that you verify all information with the listing agent, and any relevant agencies, prior to making any decisions.