Retail Space
3629 South Port Drive Sacramento, CA 95826
3629 South Port Drive Sacramento, CA 95826
Details & Description
Property Highlights
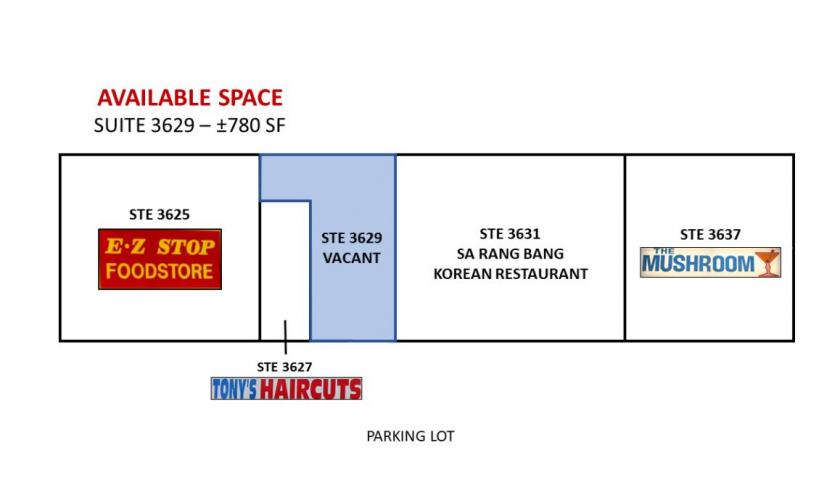
- • Established Strip Center with Great Visibility
- • Close Proximity to Highway-50
- • 40 Surface Parking Spaces Available
Listing Agents

Tuan Nguyen
KW Commercial
O: 916-798-5798
tuan@kwcommercial.com
KW Commercial
O: 916-798-5798
tuan@kwcommercial.com
While we strive to provide the most accurate information, all listing information, and demographic data, is provided by third-parties. As such, MyEListing will not be responsible for the accuracy of the information. It is strongly recommended that you verify all information with the listing agent, and any relevant agencies, prior to making any decisions.


