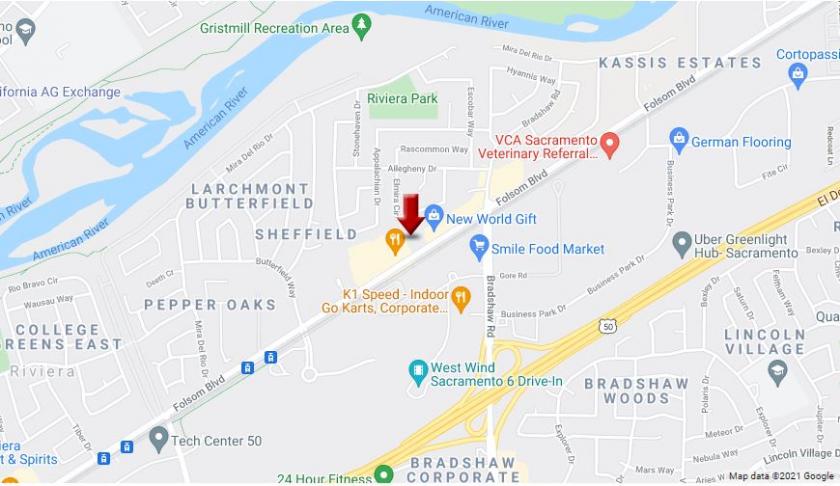
1-Mile | 3-Miles | 5-Miles | ||
---|---|---|---|---|
Total Population | 13,551 | 108,397 | 258,025 | |
Population Median Age | 40 | 38 | 38 | |
Population by Age | 0-9 Yrs | 1348 (9%) | 14048 (12%) | 31600 (12%) |
10-19 Yrs | 1491 (11%) | 12699 (11%) | 30339 (11%) | |
20-29 Yrs | 2330 (17%) | 16266 (15%) | 43364 (16%) | |
30-39 Yrs | 1879 (13%) | 15279 (14%) | 36915 (14%) | |
40-49 Yrs | 1477 (10%) | 13206 (12%) | 29353 (11%) | |
50-59 Yrs | 1886 (13%) | 13875 (12%) | 31140 (12%) | |
60-69 Yrs | 1564 (11%) | 11812 (10%) | 28169 (10%) | |
70+ Yrs | 1576 (11%) | 11213 (10%) | 27144 (10%) | |
Median HH Income | $68,005 | $69,539 | $59,803 | |
Total Household Income | < 24K | 692 (13%) | 6128 (15%) | 20087 (19%) |
25-49K | 1008 (20%) | 8444 (20%) | 23025 (22%) | |
50-74K | 1120 (22%) | 7456 (18%) | 17073 (16%) | |
75-99K | 680 (13%) | 5299 (12%) | 12537 (12%) | |
100-199K | 1203 (23%) | 9763 (23%) | 21599 (21%) | |
200K+ | 322 (6%) | 3748 (9%) | 6805 (6%) | |
Highest Education Level | No Diploma | 919 | 6376 | 16635 |
Diploma or GED | 2281 | 15920 | 38976 | |
Some College | 2663 | 18162 | 43596 | |
Assoc. Degree | 822 | 7311 | 17262 | |
Bachelors Degree | 1877 | 16639 | 38227 | |
Higher Degree | 1027 | 9454 | 20677 | |
Total Housing Units | 5,257 | 43,251 | 106,646 | |
--Owner-Occupied | 3,008 | 23,473 | 49,528 | |
--Renter-Occupied | 2,017 | 17,366 | 51,598 | |
Owner-Occupied Values | < 100K | 318 | 1163 | 2398 |
100-199K | 252 | 1927 | 4146 | |
200-299K | 913 | 6104 | 12623 | |
300-399K | 825 | 6547 | 14530 | |
400-499K | 157 | 1793 | 5700 | |
500K+ | 542 | 5940 | 10132 | |
Total Working Age Population | 11,364 | 86,748 | 209,073 | |
In Work Force | 7,036 | 55,922 | 131,833 | |
Not In Work Force | 4,328 | 30,826 | 77,240 | |
Workforce Employed | 6,485 | 52,484 | 121,637 | |
Workforce Unemployed | 528 | 3,353 | 9,985 | |
Civlian Workforce | 7,014 | 55,838 | 131,622 | |
Military Workforce | 23 | 84 | 212 | |
Total Households | 5,025 | 40,840 | 101,126 | |
Family Households | 3,231 | 26,630 | 59,682 | |
Non-Family Households | 1,794 | 14,210 | 41,444 | |
Married Couple | 2,214 | 18,014 | 39,770 | |
Other Family | 1,017 | 8,616 | 19,912 | |
Married w/Child | 821 | 7,469 | 16,507 | |
Single Male w/Child | 83 | 1,139 | 2,562 | |
Single Female w/Child | 244 | 3,134 | 7,270 |
Population Change Last Two Decades - Plus Projection
2000 | % | 2010 | % | 2020 | % | 2030 | |
---|---|---|---|---|---|---|---|
California | 33,871,648 | +10 | 37,253,956 | +9 | 40,467,295 | +8 | 43,631,295 |
Sacramento County | 1,223,499 | +16 | 1,418,788 | +11 | 1,572,195 | +12 | 1,758,565 |
Total Working Age Population:
Total Households:
Total Working Age Population:
Total Households:
Total Working Age Population:
Total Households: