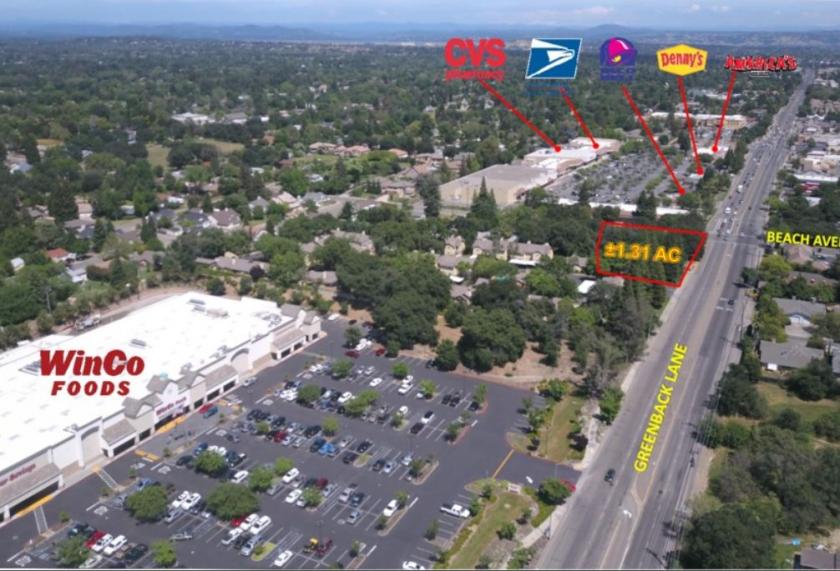
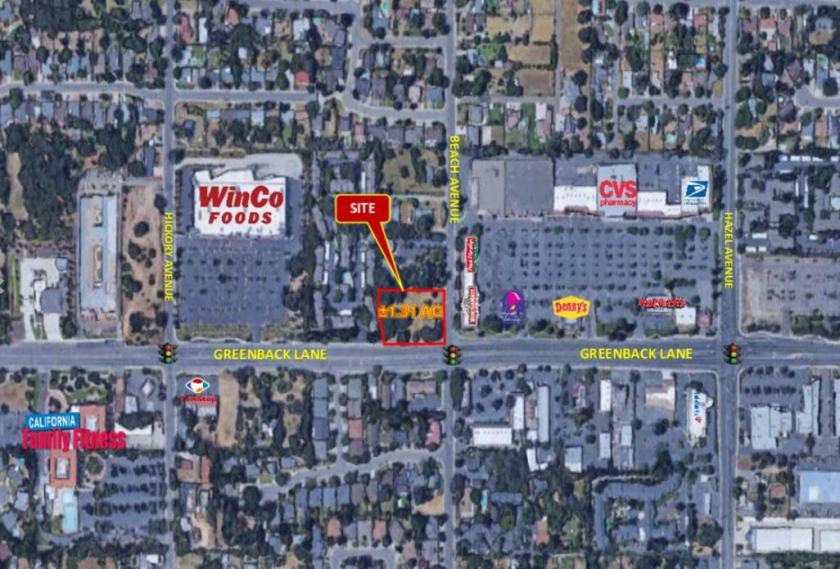
1-Mile | 3-Miles | 5-Miles | ||
---|---|---|---|---|
Total Population | 14,300 | 99,585 | 261,159 | |
Population Median Age | 40 | 41 | 41 | |
Population by Age | 0-9 Yrs | 1721 (12%) | 11205 (11%) | 28596 (10%) |
10-19 Yrs | 1584 (11%) | 11202 (11%) | 29896 (11%) | |
20-29 Yrs | 1968 (13%) | 13435 (13%) | 32999 (12%) | |
30-39 Yrs | 1892 (13%) | 13478 (13%) | 34797 (13%) | |
40-49 Yrs | 1692 (11%) | 11149 (11%) | 32503 (12%) | |
50-59 Yrs | 2066 (14%) | 14484 (14%) | 37267 (14%) | |
60-69 Yrs | 1776 (12%) | 13220 (13%) | 33973 (13%) | |
70+ Yrs | 1602 (11%) | 11411 (11%) | 31129 (11%) | |
Median HH Income | $79,258 | $76,813 | $79,313 | |
Total Household Income | < 24K | 532 (9%) | 4818 (12%) | 12940 (12%) |
25-49K | 1081 (19%) | 7059 (18%) | 16844 (16%) | |
50-74K | 941 (17%) | 7082 (18%) | 17790 (17%) | |
75-99K | 997 (18%) | 5622 (14%) | 14158 (14%) | |
100-199K | 1549 (28%) | 10578 (27%) | 27705 (27%) | |
200K+ | 347 (6%) | 3574 (9%) | 10596 (10%) | |
Highest Education Level | No Diploma | 733 | 4869 | 14214 |
Diploma or GED | 2282 | 13576 | 35486 | |
Some College | 3122 | 20845 | 51465 | |
Assoc. Degree | 975 | 8225 | 20618 | |
Bachelors Degree | 2090 | 16219 | 43029 | |
Higher Degree | 827 | 7509 | 22928 | |
Total Housing Units | 5,547 | 40,315 | 104,335 | |
--Owner-Occupied | 4,061 | 24,786 | 65,033 | |
--Renter-Occupied | 1,385 | 13,946 | 35,000 | |
Owner-Occupied Values | < 100K | 178 | 847 | 2711 |
100-199K | 72 | 492 | 2939 | |
200-299K | 629 | 3615 | 10210 | |
300-399K | 1643 | 8139 | 18152 | |
400-499K | 794 | 5008 | 12468 | |
500K+ | 745 | 6685 | 18552 | |
Total Working Age Population | 11,603 | 81,686 | 213,997 | |
In Work Force | 7,462 | 51,562 | 131,388 | |
Not In Work Force | 4,141 | 30,124 | 82,608 | |
Workforce Employed | 7,076 | 48,805 | 124,597 | |
Workforce Unemployed | 372 | 2,681 | 6,641 | |
Civlian Workforce | 7,448 | 51,486 | 131,238 | |
Military Workforce | 14 | 76 | 150 | |
Total Households | 5,446 | 38,732 | 100,033 | |
Family Households | 3,651 | 25,662 | 65,886 | |
Non-Family Households | 1,795 | 13,070 | 34,147 | |
Married Couple | 2,633 | 18,974 | 49,708 | |
Other Family | 1,018 | 6,688 | 16,178 | |
Married w/Child | 1,044 | 6,933 | 19,237 | |
Single Male w/Child | 134 | 1,009 | 2,640 | |
Single Female w/Child | 230 | 1,962 | 4,754 |
Population Change Last Two Decades - Plus Projection
2000 | % | 2010 | % | 2020 | % | 2030 | |
---|---|---|---|---|---|---|---|
California | 33,871,648 | +10 | 37,253,956 | +9 | 40,467,295 | +8 | 43,631,295 |
El Dorado County | 156,299 | +16 | 181,058 | +6 | 191,581 | +9 | 208,457 |
Placer County | 248,399 | +40 | 348,432 | +15 | 399,388 | +14 | 456,175 |
Sacramento County | 1,223,499 | +16 | 1,418,788 | +11 | 1,572,195 | +12 | 1,758,565 |
Total Working Age Population:
Total Households:
Total Working Age Population:
Total Households:
Total Working Age Population:
Total Households: