Specialty Real Estate
10244 Lost Valley Road Montague, MI 49437
10244 Lost Valley Road Montague, MI 49437

Details & Description
Property Highlights
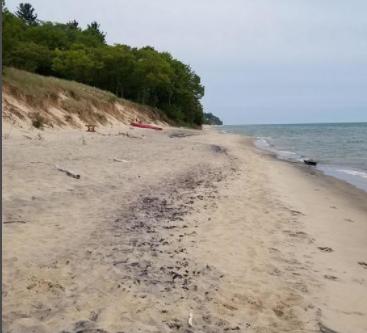
- • Direct beach access to Lake Michigan
- • Lot size 33,106sf or 0.76 Acres
- • Additional Lot to build Innkeepers suite
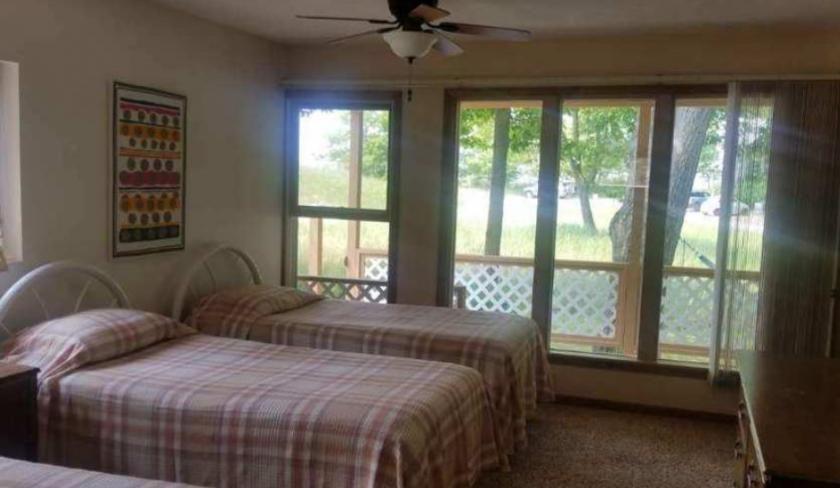
- • Beautifully maintained property
- • 10 Beds, including 2 Queens
- • Firepit, play area and gardens
Listing Agents

Andrew Ostrander
KW Commercial
O: 480-229-6999
andrewoaz@cox.net
KW Commercial
O: 480-229-6999
andrewoaz@cox.net
While we strive to provide the most accurate information, all listing information, and demographic data, is provided by third-parties. As such, MyEListing will not be responsible for the accuracy of the information. It is strongly recommended that you verify all information with the listing agent, and any relevant agencies, prior to making any decisions.