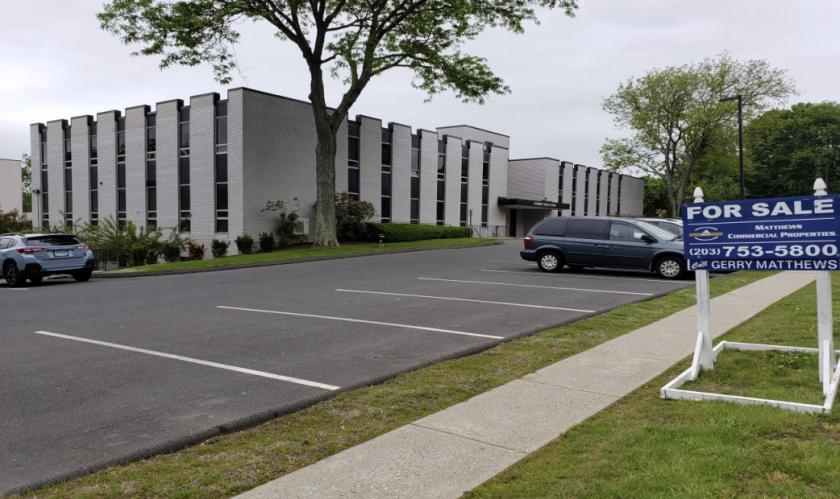
1-Mile | 3-Miles | 5-Miles | ||
---|---|---|---|---|
Total Population | 9,054 | 90,156 | 163,349 | |
Population Median Age | 37 | 37 | 38 | |
Population by Age | 0-9 Yrs | 1362 (15%) | 12051 (13%) | 21178 (12%) |
10-19 Yrs | 930 (10%) | 12520 (13%) | 20130 (12%) | |
20-29 Yrs | 1805 (19%) | 14031 (15%) | 23264 (14%) | |
30-39 Yrs | 1112 (12%) | 11271 (12%) | 21065 (12%) | |
40-49 Yrs | 928 (10%) | 11734 (13%) | 20720 (12%) | |
50-59 Yrs | 1145 (12%) | 11250 (12%) | 22617 (13%) | |
60-69 Yrs | 865 (9%) | 8689 (9%) | 17822 (10%) | |
70+ Yrs | 908 (10%) | 8610 (9%) | 16553 (10%) | |
Median HH Income | $45,818 | $43,900 | $53,764 | |
Total Household Income | < 24K | 894 (24%) | 10237 (30%) | 15180 (24%) |
25-49K | 1041 (28%) | 8195 (24%) | 13877 (22%) | |
50-74K | 450 (12%) | 4962 (14%) | 9597 (15%) | |
75-99K | 548 (14%) | 3904 (11%) | 7441 (12%) | |
100-199K | 615 (16%) | 5364 (15%) | 12485 (20%) | |
200K+ | 124 (3%) | 1064 (3%) | 2957 (4%) | |
Highest Education Level | No Diploma | 837 | 11867 | 17527 |
Diploma or GED | 2288 | 20635 | 38394 | |
Some College | 1207 | 11311 | 21505 | |
Assoc. Degree | 267 | 4324 | 8886 | |
Bachelors Degree | 731 | 6230 | 13959 | |
Higher Degree | 569 | 4217 | 10061 | |
Total Housing Units | 4,296 | 39,392 | 70,066 | |
--Owner-Occupied | 1,812 | 15,183 | 32,667 | |
--Renter-Occupied | 1,861 | 18,544 | 28,870 | |
Owner-Occupied Values | < 100K | 387 | 3762 | 5564 |
100-199K | 1097 | 7416 | 14900 | |
200-299K | 255 | 2600 | 7742 | |
300-399K | 30 | 730 | 2619 | |
400-499K | 5 | 282 | 818 | |
500K+ | 39 | 392 | 1024 | |
Total Working Age Population | 7,200 | 70,600 | 129,950 | |
In Work Force | 4,796 | 44,024 | 83,651 | |
Not In Work Force | 2,404 | 26,576 | 46,299 | |
Workforce Employed | 4,479 | 39,708 | 76,916 | |
Workforce Unemployed | 317 | 4,256 | 6,663 | |
Civlian Workforce | 4,796 | 43,965 | 83,579 | |
Military Workforce | 0 | 59 | 72 | |
Total Households | 3,673 | 33,727 | 61,536 | |
Family Households | 2,041 | 20,878 | 39,494 | |
Non-Family Households | 1,632 | 12,849 | 22,042 | |
Married Couple | 1,133 | 11,251 | 24,239 | |
Other Family | 909 | 9,627 | 15,255 | |
Married w/Child | 417 | 4,672 | 9,347 | |
Single Male w/Child | 201 | 860 | 1,286 | |
Single Female w/Child | 341 | 4,399 | 6,551 |
Population Change Last Two Decades - Plus Projection
2000 | % | 2010 | % | 2020 | % | 2030 | |
---|---|---|---|---|---|---|---|
Connecticut | 3,405,565 | +5 | 3,574,097 | +1 | 3,604,603 | +1 | 3,633,994 |
Fairfield County | 882,567 | +4 | 916,829 | -1 | 907,603 | -1 | 897,553 |
Hartford County | 857,183 | +4 | 894,014 | +2 | 909,671 | +2 | 930,629 |
Litchfield County | 182,193 | +4 | 189,927 | -2 | 186,611 | -3 | 180,866 |
New Haven County | 824,008 | +5 | 862,477 | +1 | 873,659 | +2 | 891,371 |
Total Working Age Population:
Total Households:
Total Working Age Population:
Total Households:
Total Working Age Population:
Total Households: