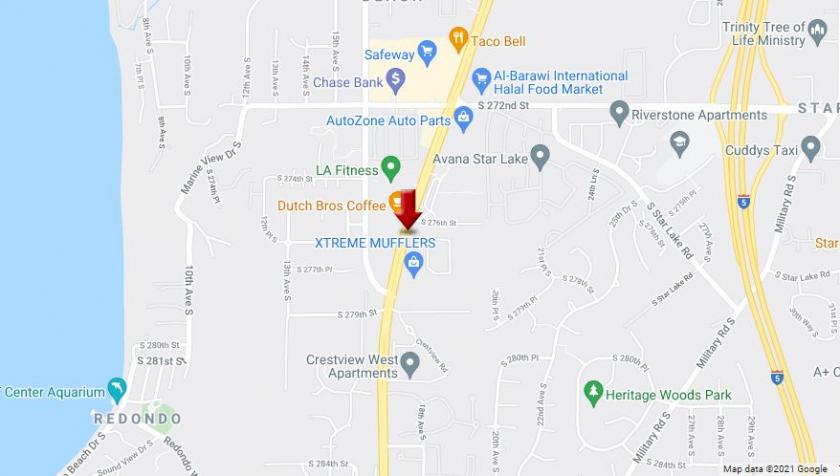
1-Mile | 3-Miles | 5-Miles | ||
---|---|---|---|---|
Total Population | 16,726 | 95,110 | 209,140 | |
Population Median Age | 35 | 38 | 38 | |
Population by Age | 0-9 Yrs | 2440 (14%) | 12914 (13%) | 28120 (13%) |
10-19 Yrs | 2309 (13%) | 11445 (12%) | 25399 (12%) | |
20-29 Yrs | 2953 (17%) | 13761 (14%) | 30195 (14%) | |
30-39 Yrs | 2470 (14%) | 13804 (14%) | 30981 (14%) | |
40-49 Yrs | 1976 (11%) | 12007 (12%) | 27005 (12%) | |
50-59 Yrs | 1505 (8%) | 12216 (12%) | 25901 (12%) | |
60-69 Yrs | 1954 (11%) | 10351 (10%) | 22183 (10%) | |
70+ Yrs | 1119 (6%) | 8612 (9%) | 19356 (9%) | |
Median HH Income | $63,784 | $70,582 | $67,997 | |
Total Household Income | < 24K | 883 (14%) | 4432 (12%) | 11528 (14%) |
25-49K | 1507 (24%) | 6849 (20%) | 15837 (20%) | |
50-74K | 1369 (22%) | 7008 (20%) | 15610 (20%) | |
75-99K | 850 (13%) | 4685 (13%) | 10521 (13%) | |
100-199K | 1302 (20%) | 8962 (26%) | 19289 (24%) | |
200K+ | 304 (4%) | 2216 (6%) | 4519 (5%) | |
Highest Education Level | No Diploma | 1420 | 8460 | 17274 |
Diploma or GED | 2976 | 17411 | 37098 | |
Some College | 2256 | 15341 | 34641 | |
Assoc. Degree | 1066 | 6982 | 15369 | |
Bachelors Degree | 1979 | 11853 | 26359 | |
Higher Degree | 886 | 4448 | 10876 | |
Total Housing Units | 6,460 | 35,975 | 81,692 | |
--Owner-Occupied | 3,016 | 20,729 | 42,158 | |
--Renter-Occupied | 3,198 | 13,423 | 35,145 | |
Owner-Occupied Values | < 100K | 136 | 1175 | 2680 |
100-199K | 342 | 2039 | 4077 | |
200-299K | 516 | 5223 | 10060 | |
300-399K | 1001 | 6081 | 12304 | |
400-499K | 536 | 3353 | 7165 | |
500K+ | 484 | 2859 | 5872 | |
Total Working Age Population | 13,077 | 75,594 | 166,345 | |
In Work Force | 9,260 | 50,881 | 110,364 | |
Not In Work Force | 3,817 | 24,713 | 55,981 | |
Workforce Employed | 8,603 | 48,272 | 104,072 | |
Workforce Unemployed | 595 | 2,464 | 6,038 | |
Civlian Workforce | 9,198 | 50,735 | 110,110 | |
Military Workforce | 62 | 146 | 254 | |
Total Households | 6,214 | 34,152 | 77,303 | |
Family Households | 3,790 | 23,124 | 49,755 | |
Non-Family Households | 2,424 | 11,028 | 27,548 | |
Married Couple | 2,561 | 16,185 | 34,432 | |
Other Family | 1,229 | 6,939 | 15,323 | |
Married w/Child | 1,102 | 6,640 | 14,516 | |
Single Male w/Child | 142 | 973 | 2,255 | |
Single Female w/Child | 524 | 2,446 | 5,430 |
Population Change Last Two Decades - Plus Projection
2000 | % | 2010 | % | 2020 | % | 2030 | |
---|---|---|---|---|---|---|---|
Washington | 5,894,121 | +14 | 6,724,540 | +14 | 7,638,415 | +11 | 8,503,178 |
King County | 1,737,034 | +11 | 1,931,249 | +16 | 2,231,408 | +11 | 2,474,625 |
Pierce County | 700,820 | +13 | 795,225 | +13 | 901,251 | +11 | 1,002,412 |
Total Working Age Population:
Total Households:
Total Working Age Population:
Total Households:
Total Working Age Population:
Total Households: