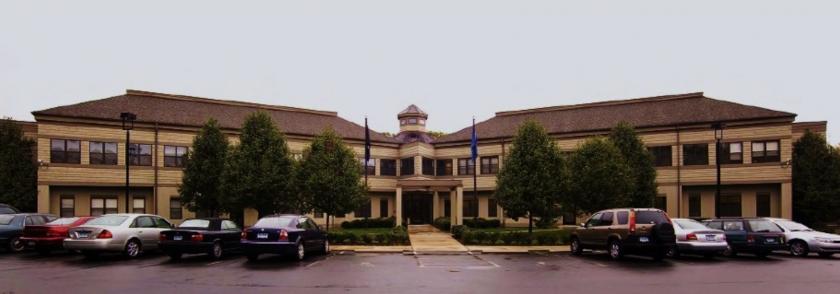
1-Mile | 3-Miles | 5-Miles | ||
---|---|---|---|---|
Total Population | 3,413 | 15,212 | 32,200 | |
Population Median Age | 61 | 50 | 46 | |
Population by Age | 0-9 Yrs | 120 (3%) | 1253 (8%) | 2927 (9%) |
10-19 Yrs | 252 (7%) | 1932 (12%) | 4365 (13%) | |
20-29 Yrs | 98 (2%) | 822 (5%) | 2220 (6%) | |
30-39 Yrs | 135 (3%) | 872 (5%) | 2336 (7%) | |
40-49 Yrs | 215 (6%) | 1646 (10%) | 3836 (11%) | |
50-59 Yrs | 260 (7%) | 2039 (13%) | 5518 (17%) | |
60-69 Yrs | 700 (20%) | 2415 (15%) | 4653 (14%) | |
70+ Yrs | 1633 (47%) | 4233 (27%) | 6346 (19%) | |
Median HH Income | $58,038 | $86,331 | $97,218 | |
Total Household Income | < 24K | 375 (19%) | 950 (14%) | 1406 (10%) |
25-49K | 388 (20%) | 975 (14%) | 1722 (13%) | |
50-74K | 387 (20%) | 1096 (16%) | 2002 (15%) | |
75-99K | 166 (8%) | 725 (10%) | 1590 (12%) | |
100-199K | 394 (20%) | 1987 (29%) | 4058 (31%) | |
200K+ | 175 (9%) | 966 (14%) | 2308 (17%) | |
Highest Education Level | No Diploma | 132 | 551 | 1161 |
Diploma or GED | 782 | 2545 | 4966 | |
Some College | 516 | 1828 | 3582 | |
Assoc. Degree | 265 | 1002 | 2072 | |
Bachelors Degree | 677 | 2988 | 6251 | |
Higher Degree | 629 | 2663 | 5660 | |
Total Housing Units | 2,191 | 7,516 | 14,517 | |
--Owner-Occupied | 1,402 | 5,443 | 10,968 | |
--Renter-Occupied | 483 | 1,256 | 2,117 | |
Owner-Occupied Values | < 100K | 249 | 510 | 553 |
100-199K | 522 | 1326 | 1801 | |
200-299K | 241 | 870 | 2000 | |
300-399K | 171 | 1108 | 2799 | |
400-499K | 149 | 952 | 2064 | |
500K+ | 70 | 678 | 1751 | |
Total Working Age Population | 3,151 | 12,787 | 26,597 | |
In Work Force | 1,216 | 6,800 | 16,353 | |
Not In Work Force | 1,934 | 5,988 | 10,244 | |
Workforce Employed | 1,127 | 6,537 | 15,643 | |
Workforce Unemployed | 90 | 263 | 710 | |
Civlian Workforce | 1,216 | 6,800 | 16,353 | |
Military Workforce | 0 | 0 | 0 | |
Total Households | 1,886 | 6,698 | 13,085 | |
Family Households | 809 | 3,964 | 8,744 | |
Non-Family Households | 1,077 | 2,735 | 4,341 | |
Married Couple | 665 | 3,302 | 7,397 | |
Other Family | 144 | 661 | 1,347 | |
Married w/Child | 126 | 1,037 | 2,603 | |
Single Male w/Child | 3 | 67 | 182 | |
Single Female w/Child | 13 | 225 | 452 |
Population Change Last Two Decades - Plus Projection
2000 | % | 2010 | % | 2020 | % | 2030 | |
---|---|---|---|---|---|---|---|
Connecticut | 3,405,565 | +5 | 3,574,097 | +1 | 3,604,603 | +1 | 3,633,994 |
Fairfield County | 882,567 | +4 | 916,829 | -1 | 907,603 | -1 | 897,553 |
Litchfield County | 182,193 | +4 | 189,927 | -2 | 186,611 | -3 | 180,866 |
New Haven County | 824,008 | +5 | 862,477 | +1 | 873,659 | +2 | 891,371 |
Total Working Age Population:
Total Households:
Total Working Age Population:
Total Households:
Total Working Age Population:
Total Households: