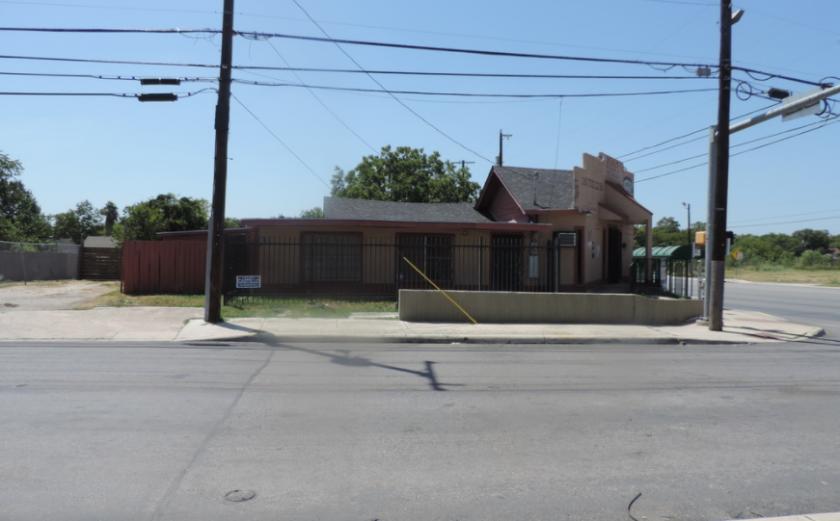
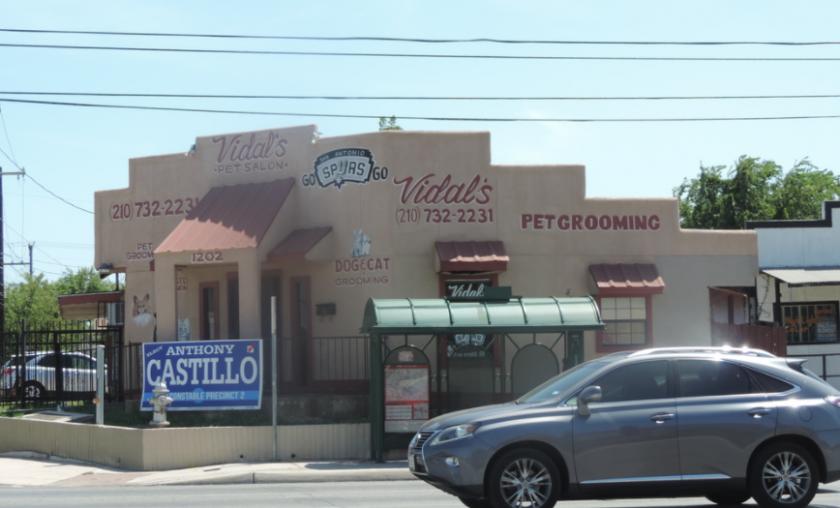
1-Mile | 3-Miles | 5-Miles | ||
---|---|---|---|---|
Total Population | 21,557 | 176,647 | 401,756 | |
Population Median Age | 37 | 37 | 37 | |
Population by Age | 0-9 Yrs | 3289 (15%) | 22776 (12%) | 54079 (13%) |
10-19 Yrs | 2699 (12%) | 24587 (13%) | 56321 (14%) | |
20-29 Yrs | 3139 (14%) | 27754 (15%) | 61931 (15%) | |
30-39 Yrs | 2866 (13%) | 23783 (13%) | 56580 (14%) | |
40-49 Yrs | 2782 (12%) | 22107 (12%) | 49803 (12%) | |
50-59 Yrs | 2711 (12%) | 21181 (11%) | 48326 (12%) | |
60-69 Yrs | 1916 (8%) | 16857 (9%) | 37725 (9%) | |
70+ Yrs | 2155 (9%) | 17602 (9%) | 36991 (9%) | |
Median HH Income | $34,965 | $35,880 | $38,289 | |
Total Household Income | < 24K | 2452 (39%) | 20505 (36%) | 44002 (33%) |
25-49K | 1669 (26%) | 15202 (27%) | 34856 (26%) | |
50-74K | 1035 (16%) | 8962 (16%) | 21908 (16%) | |
75-99K | 662 (10%) | 4696 (8%) | 11924 (9%) | |
100-199K | 388 (6%) | 5109 (9%) | 12712 (9%) | |
200K+ | 77 (1%) | 1193 (2%) | 4153 (3%) | |
Highest Education Level | No Diploma | 5483 | 39361 | 76511 |
Diploma or GED | 4208 | 34922 | 77995 | |
Some College | 2389 | 19943 | 50881 | |
Assoc. Degree | 598 | 5064 | 13161 | |
Bachelors Degree | 1172 | 10655 | 27238 | |
Higher Degree | 357 | 6305 | 16149 | |
Total Housing Units | 7,341 | 63,238 | 146,146 | |
--Owner-Occupied | 3,849 | 27,759 | 65,470 | |
--Renter-Occupied | 2,434 | 27,908 | 64,085 | |
Owner-Occupied Values | < 100K | 2649 | 16886 | 36239 |
100-199K | 907 | 7352 | 18160 | |
200-299K | 202 | 1726 | 4419 | |
300-399K | 74 | 697 | 1863 | |
400-499K | 10 | 366 | 1173 | |
500K+ | 7 | 732 | 3616 | |
Total Working Age Population | 16,613 | 140,452 | 315,258 | |
In Work Force | 9,519 | 79,362 | 184,427 | |
Not In Work Force | 7,094 | 61,090 | 130,831 | |
Workforce Employed | 8,914 | 74,069 | 172,190 | |
Workforce Unemployed | 606 | 5,086 | 11,009 | |
Civlian Workforce | 9,519 | 79,155 | 183,199 | |
Military Workforce | 0 | 207 | 1,228 | |
Total Households | 6,283 | 55,667 | 129,555 | |
Family Households | 4,374 | 33,536 | 78,938 | |
Non-Family Households | 1,909 | 22,131 | 50,617 | |
Married Couple | 2,496 | 19,042 | 45,581 | |
Other Family | 1,878 | 14,494 | 33,357 | |
Married w/Child | 817 | 6,800 | 17,162 | |
Single Male w/Child | 109 | 838 | 2,300 | |
Single Female w/Child | 615 | 5,728 | 13,016 |
Population Change Last Two Decades - Plus Projection
2000 | % | 2010 | % | 2020 | % | 2030 | |
---|---|---|---|---|---|---|---|
Texas | 20,851,820 | +21 | 25,145,561 | +18 | 29,677,668 | +18 | 34,894,452 |
Bexar County | 1,392,931 | +23 | 1,714,773 | +22 | 2,093,502 | +20 | 2,502,617 |
Total Working Age Population:
Total Households:
Total Working Age Population:
Total Households:
Total Working Age Population:
Total Households: