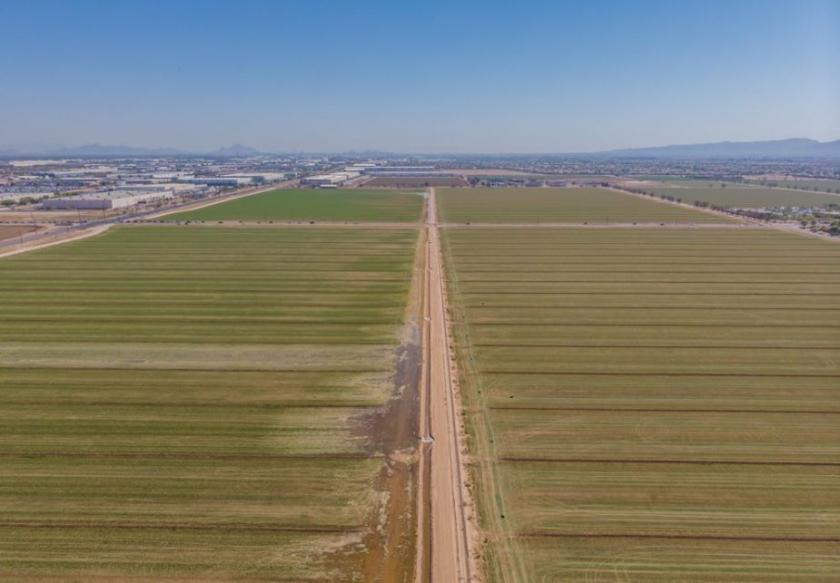
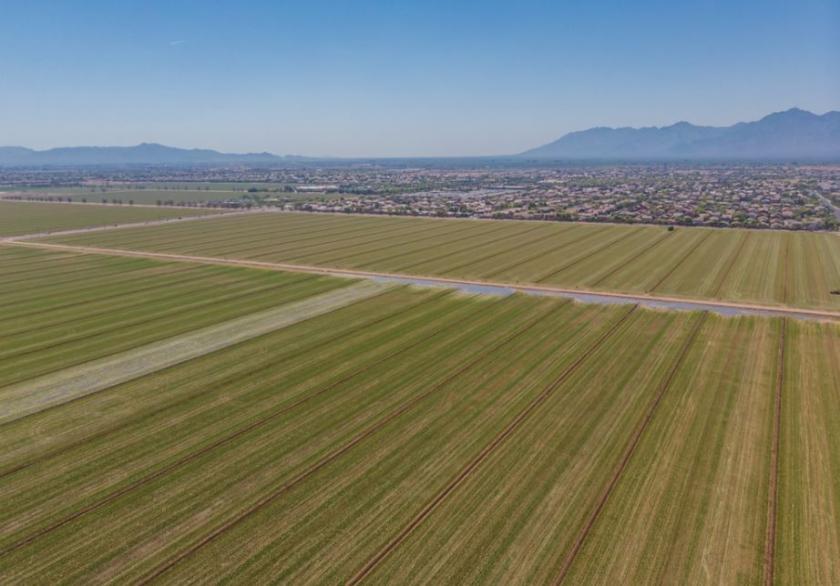
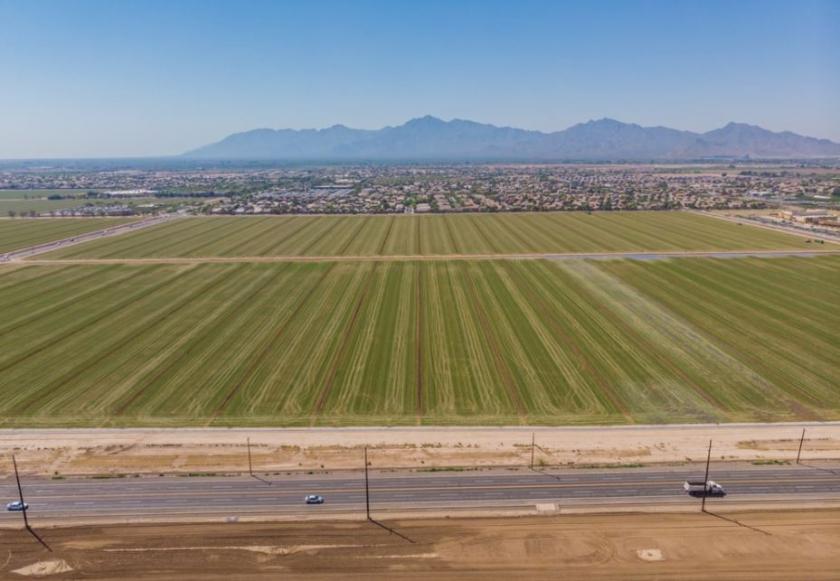
Commercial Land
9901 West Buckeye Road Tolleson, AZ 85353
9901 West Buckeye Road Tolleson, AZ 85353
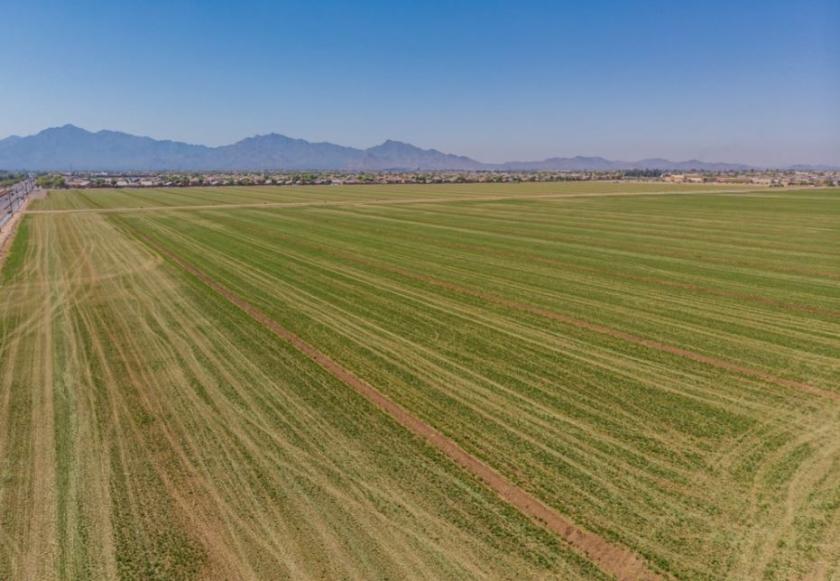
Details & Description
Property Highlights
- • Ideal for development
- • Location, Location, Location
- • Surrounding areas being developed for housing
- • Possible hard corner at 99th Ave and MC85
- • 99th Avenue in City Plans for 4 - lanes
Additional Photos
Listing Agents

Bill Nanney
KW Commercial
O: 480-759-4300
M: 480-686-1440
wjnanney@cox.net
KW Commercial
O: 480-759-4300
M: 480-686-1440
wjnanney@cox.net
While we strive to provide the most accurate information, all listing information, and demographic data, is provided by third-parties. As such, MyEListing will not be responsible for the accuracy of the information. It is strongly recommended that you verify all information with the listing agent, and any relevant agencies, prior to making any decisions.


